ノート
完全なサンプルコードをダウンロードするには、ここをクリックしてください
プロットに注釈を付ける#
次の例は、Matplotlib でプロットに注釈を付ける方法を示しています。これには、特定の関心のあるポイントを強調表示し、さまざまな視覚ツールを使用してこのポイントに注意を喚起することが含まれます。Matplotlib の注釈およびテキスト ツールのより完全で詳細な説明については、注釈に関する チュートリアルを参照してください。
import matplotlib.pyplot as plt
from matplotlib.patches import Ellipse
import numpy as np
from matplotlib.text import OffsetFrom
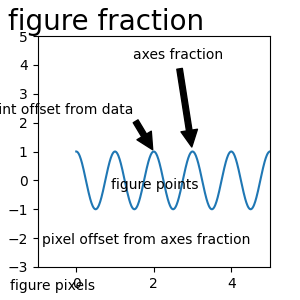
テキストポイントと注釈ポイントの指定#
この点に注釈を付けるには、注釈点を指定する必要があります。さらに、この注釈のテキストの位置にテキスト ポイントを指定することもできます。必要に応じて、 xycoords
とtextcoordsの次のいずれかの文字列を使用して、 xyとxytextの座標系を指定できます(既定値は 'data' です)。xy=(x, y)xytext=(x, y)
'figure points'   : points from the lower left corner of the figure
'figure pixels'   : pixels from the lower left corner of the figure
'figure fraction' : (0, 0) is lower left of figure and (1, 1) is upper right
'axes points'     : points from lower left corner of axes
'axes pixels'     : pixels from lower left corner of axes
'axes fraction'   : (0, 0) is lower left of axes and (1, 1) is upper right
'offset points'   : Specify an offset (in points) from the xy value
'offset pixels'   : Specify an offset (in pixels) from the xy value
'data'            : use the axes data coordinate system
注: 物理座標系 (ポイントまたはピクセル) の場合、原点は図または軸の (下、左) です。
必要に応じて、矢印プロパティのディクショナリを指定することで、テキストから注釈付きポイントに矢印を描画して矢印を付ける矢印プロパティを指定できます。
有効なキーは次のとおりです。
width : the width of the arrow in points
frac  : the fraction of the arrow length occupied by the head
headwidth : the width of the base of the arrow head in points
shrink : move the tip and base some percent away from the
         annotated point and text
any key for matplotlib.patches.polygon  (e.g., facecolor)
# Create our figure and data we'll use for plotting
fig, ax = plt.subplots(figsize=(3, 3))

t = np.arange(0.0, 5.0, 0.01)
s = np.cos(2*np.pi*t)

# Plot a line and add some simple annotations
line, = ax.plot(t, s)
ax.annotate('figure pixels',
            xy=(10, 10), xycoords='figure pixels')
ax.annotate('figure points',
            xy=(80, 80), xycoords='figure points')
ax.annotate('figure fraction',
            xy=(.025, .975), xycoords='figure fraction',
            horizontalalignment='left', verticalalignment='top',
            fontsize=20)

# The following examples show off how these arrows are drawn.

ax.annotate('point offset from data',
            xy=(2, 1), xycoords='data',
            xytext=(-15, 25), textcoords='offset points',
            arrowprops=dict(facecolor='black', shrink=0.05),
            horizontalalignment='right', verticalalignment='bottom')

ax.annotate('axes fraction',
            xy=(3, 1), xycoords='data',
            xytext=(0.8, 0.95), textcoords='axes fraction',
            arrowprops=dict(facecolor='black', shrink=0.05),
            horizontalalignment='right', verticalalignment='top')

# You may also use negative points or pixels to specify from (right, top).
# E.g., (-10, 10) is 10 points to the left of the right side of the axes and 10
# points above the bottom

ax.annotate('pixel offset from axes fraction',
            xy=(1, 0), xycoords='axes fraction',
            xytext=(-20, 20), textcoords='offset pixels',
            horizontalalignment='right',
            verticalalignment='bottom')

ax.set(xlim=(-1, 5), ylim=(-3, 5))
[(-1.0, 5.0), (-3.0, 5.0)]
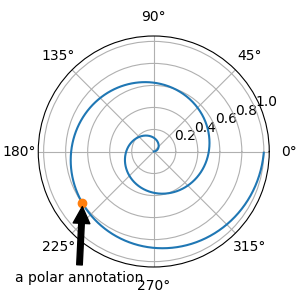
複数の座標系と軸タイプの使用#
異なる位置と座標系でxypointとxytextを指定し、必要に応じて接続線をオンにして点をマーカーでマークすることができます。注釈は極軸でも機能します。
以下の例では、xyポイントはネイティブ座標にあります ( xycoords の既定値は 'data' です)。極軸の場合、これは (シータ、半径) 空間にあります。例のテキストは、分数図形座標系に配置されています。水平方向および垂直方向の配置などのテキスト キーワード引数が考慮されます。
fig, ax = plt.subplots(subplot_kw=dict(projection='polar'), figsize=(3, 3))
r = np.arange(0, 1, 0.001)
theta = 2*2*np.pi*r
line, = ax.plot(theta, r)

ind = 800
thisr, thistheta = r[ind], theta[ind]
ax.plot([thistheta], [thisr], 'o')
ax.annotate('a polar annotation',
            xy=(thistheta, thisr),  # theta, radius
            xytext=(0.05, 0.05),    # fraction, fraction
            textcoords='figure fraction',
            arrowprops=dict(facecolor='black', shrink=0.05),
            horizontalalignment='left',
            verticalalignment='bottom')
Text(0.05, 0.05, 'a polar annotation')
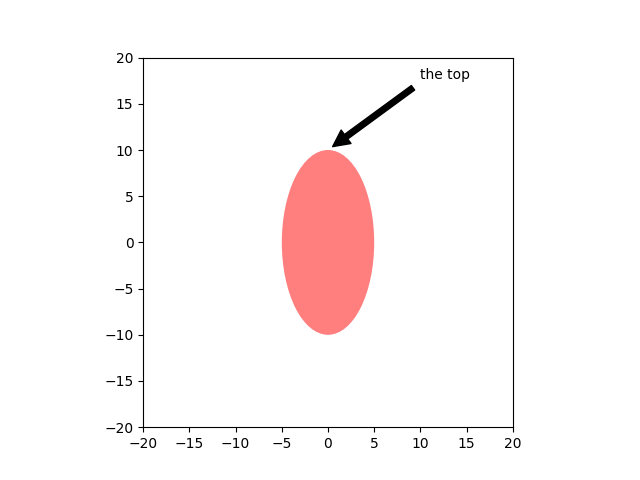
デカルト軸で極座標表記を使用することもできます。ここで、ネイティブ座標系 ('data') はデカルトであるため、(theta, radius) を使用する場合は、xycoords と textcoords を 'polar' として指定する必要があります。
el = Ellipse((0, 0), 10, 20, facecolor='r', alpha=0.5)

fig, ax = plt.subplots(subplot_kw=dict(aspect='equal'))
ax.add_artist(el)
el.set_clip_box(ax.bbox)
ax.annotate('the top',
            xy=(np.pi/2., 10.),      # theta, radius
            xytext=(np.pi/3, 20.),   # theta, radius
            xycoords='polar',
            textcoords='polar',
            arrowprops=dict(facecolor='black', shrink=0.05),
            horizontalalignment='left',
            verticalalignment='bottom',
            clip_on=True)  # clip to the axes bounding box

ax.set(xlim=[-20, 20], ylim=[-20, 20])
[(-20.0, 20.0), (-20.0, 20.0)]
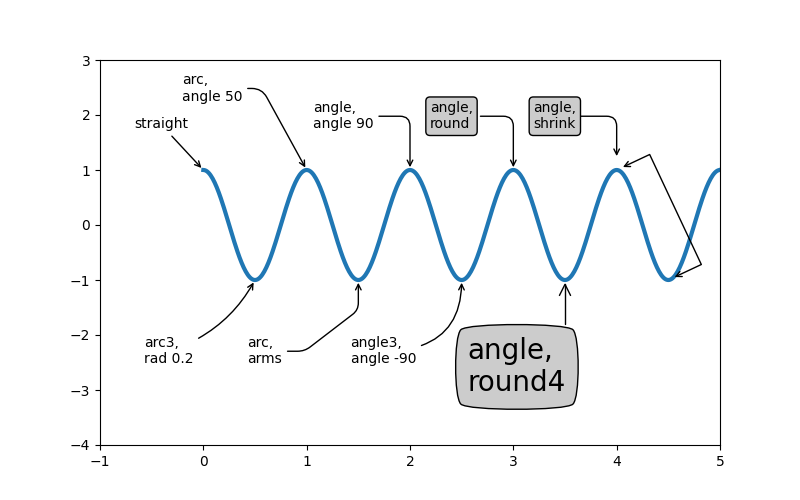
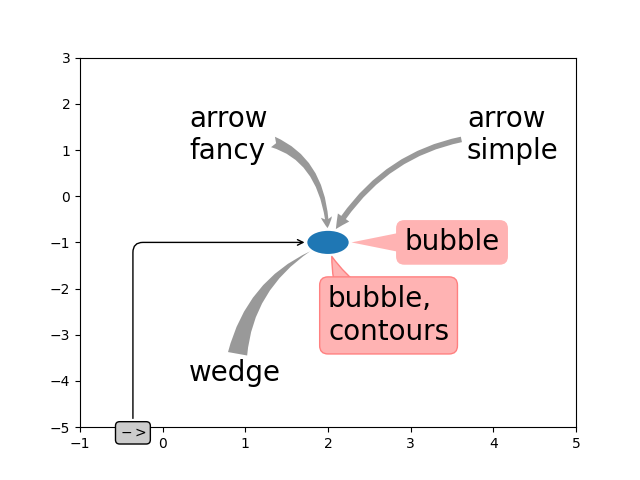
矢印とバブルのスタイルのカスタマイズ#
xytextと注釈ポイントの間の矢印、および注釈テキストを覆うバブルは高度にカスタマイズ可能です。以下は、いくつかのパラメータ オプションとその結果の出力です。
fig, ax = plt.subplots(figsize=(8, 5))

t = np.arange(0.0, 5.0, 0.01)
s = np.cos(2*np.pi*t)
line, = ax.plot(t, s, lw=3)

ax.annotate(
    'straight',
    xy=(0, 1), xycoords='data',
    xytext=(-50, 30), textcoords='offset points',
    arrowprops=dict(arrowstyle="->"))
ax.annotate(
    'arc3,\nrad 0.2',
    xy=(0.5, -1), xycoords='data',
    xytext=(-80, -60), textcoords='offset points',
    arrowprops=dict(arrowstyle="->",
                    connectionstyle="arc3,rad=.2"))
ax.annotate(
    'arc,\nangle 50',
    xy=(1., 1), xycoords='data',
    xytext=(-90, 50), textcoords='offset points',
    arrowprops=dict(arrowstyle="->",
                    connectionstyle="arc,angleA=0,armA=50,rad=10"))
ax.annotate(
    'arc,\narms',
    xy=(1.5, -1), xycoords='data',
    xytext=(-80, -60), textcoords='offset points',
    arrowprops=dict(
        arrowstyle="->",
        connectionstyle="arc,angleA=0,armA=40,angleB=-90,armB=30,rad=7"))
ax.annotate(
    'angle,\nangle 90',
    xy=(2., 1), xycoords='data',
    xytext=(-70, 30), textcoords='offset points',
    arrowprops=dict(arrowstyle="->",
                    connectionstyle="angle,angleA=0,angleB=90,rad=10"))
ax.annotate(
    'angle3,\nangle -90',
    xy=(2.5, -1), xycoords='data',
    xytext=(-80, -60), textcoords='offset points',
    arrowprops=dict(arrowstyle="->",
                    connectionstyle="angle3,angleA=0,angleB=-90"))
ax.annotate(
    'angle,\nround',
    xy=(3., 1), xycoords='data',
    xytext=(-60, 30), textcoords='offset points',
    bbox=dict(boxstyle="round", fc="0.8"),
    arrowprops=dict(arrowstyle="->",
                    connectionstyle="angle,angleA=0,angleB=90,rad=10"))
ax.annotate(
    'angle,\nround4',
    xy=(3.5, -1), xycoords='data',
    xytext=(-70, -80), textcoords='offset points',
    size=20,
    bbox=dict(boxstyle="round4,pad=.5", fc="0.8"),
    arrowprops=dict(arrowstyle="->",
                    connectionstyle="angle,angleA=0,angleB=-90,rad=10"))
ax.annotate(
    'angle,\nshrink',
    xy=(4., 1), xycoords='data',
    xytext=(-60, 30), textcoords='offset points',
    bbox=dict(boxstyle="round", fc="0.8"),
    arrowprops=dict(arrowstyle="->",
                    shrinkA=0, shrinkB=10,
                    connectionstyle="angle,angleA=0,angleB=90,rad=10"))
# You can pass an empty string to get only annotation arrows rendered
ax.annotate('', xy=(4., 1.), xycoords='data',
            xytext=(4.5, -1), textcoords='data',
            arrowprops=dict(arrowstyle="<->",
                            connectionstyle="bar",
                            ec="k",
                            shrinkA=5, shrinkB=5))

ax.set(xlim=(-1, 5), ylim=(-4, 3))
[(-1.0, 5.0), (-4.0, 3.0)]
乱雑にならないように、別の図を作成します。
fig, ax = plt.subplots()

el = Ellipse((2, -1), 0.5, 0.5)
ax.add_patch(el)

ax.annotate('$->$',
            xy=(2., -1), xycoords='data',
            xytext=(-150, -140), textcoords='offset points',
            bbox=dict(boxstyle="round", fc="0.8"),
            arrowprops=dict(arrowstyle="->",
                            patchB=el,
                            connectionstyle="angle,angleA=90,angleB=0,rad=10"))
ax.annotate('arrow\nfancy',
            xy=(2., -1), xycoords='data',
            xytext=(-100, 60), textcoords='offset points',
            size=20,
            arrowprops=dict(arrowstyle="fancy",
                            fc="0.6", ec="none",
                            patchB=el,
                            connectionstyle="angle3,angleA=0,angleB=-90"))
ax.annotate('arrow\nsimple',
            xy=(2., -1), xycoords='data',
            xytext=(100, 60), textcoords='offset points',
            size=20,
            arrowprops=dict(arrowstyle="simple",
                            fc="0.6", ec="none",
                            patchB=el,
                            connectionstyle="arc3,rad=0.3"))
ax.annotate('wedge',
            xy=(2., -1), xycoords='data',
            xytext=(-100, -100), textcoords='offset points',
            size=20,
            arrowprops=dict(arrowstyle="wedge,tail_width=0.7",
                            fc="0.6", ec="none",
                            patchB=el,
                            connectionstyle="arc3,rad=-0.3"))
ax.annotate('bubble,\ncontours',
            xy=(2., -1), xycoords='data',
            xytext=(0, -70), textcoords='offset points',
            size=20,
            bbox=dict(boxstyle="round",
                      fc=(1.0, 0.7, 0.7),
                      ec=(1., .5, .5)),
            arrowprops=dict(arrowstyle="wedge,tail_width=1.",
                            fc=(1.0, 0.7, 0.7), ec=(1., .5, .5),
                            patchA=None,
                            patchB=el,
                            relpos=(0.2, 0.8),
                            connectionstyle="arc3,rad=-0.1"))
ax.annotate('bubble',
            xy=(2., -1), xycoords='data',
            xytext=(55, 0), textcoords='offset points',
            size=20, va="center",
            bbox=dict(boxstyle="round", fc=(1.0, 0.7, 0.7), ec="none"),
            arrowprops=dict(arrowstyle="wedge,tail_width=1.",
                            fc=(1.0, 0.7, 0.7), ec="none",
                            patchA=None,
                            patchB=el,
                            relpos=(0.2, 0.5)))

ax.set(xlim=(-1, 5), ylim=(-5, 3))
[(-1.0, 5.0), (-5.0, 3.0)]
座標系のその他の例#
以下に、座標系の例と、注釈の位置を指定する方法をいくつか示します。
fig, (ax1, ax2) = plt.subplots(1, 2)

bbox_args = dict(boxstyle="round", fc="0.8")
arrow_args = dict(arrowstyle="->")

# Here we'll demonstrate the extents of the coordinate system and how
# we place annotating text.

ax1.annotate('figure fraction : 0, 0', xy=(0, 0), xycoords='figure fraction',
             xytext=(20, 20), textcoords='offset points',
             ha="left", va="bottom",
             bbox=bbox_args,
             arrowprops=arrow_args)

ax1.annotate('figure fraction : 1, 1', xy=(1, 1), xycoords='figure fraction',
             xytext=(-20, -20), textcoords='offset points',
             ha="right", va="top",
             bbox=bbox_args,
             arrowprops=arrow_args)

ax1.annotate('axes fraction : 0, 0', xy=(0, 0), xycoords='axes fraction',
             xytext=(20, 20), textcoords='offset points',
             ha="left", va="bottom",
             bbox=bbox_args,
             arrowprops=arrow_args)

ax1.annotate('axes fraction : 1, 1', xy=(1, 1), xycoords='axes fraction',
             xytext=(-20, -20), textcoords='offset points',
             ha="right", va="top",
             bbox=bbox_args,
             arrowprops=arrow_args)

# It is also possible to generate draggable annotations

an1 = ax1.annotate('Drag me 1', xy=(.5, .7), xycoords='data',
                   ha="center", va="center",
                   bbox=bbox_args)

an2 = ax1.annotate('Drag me 2', xy=(.5, .5), xycoords=an1,
                   xytext=(.5, .3), textcoords='axes fraction',
                   ha="center", va="center",
                   bbox=bbox_args,
                   arrowprops=dict(patchB=an1.get_bbox_patch(),
                                   connectionstyle="arc3,rad=0.2",
                                   **arrow_args))
an1.draggable()
an2.draggable()

an3 = ax1.annotate('', xy=(.5, .5), xycoords=an2,
                   xytext=(.5, .5), textcoords=an1,
                   ha="center", va="center",
                   bbox=bbox_args,
                   arrowprops=dict(patchA=an1.get_bbox_patch(),
                                   patchB=an2.get_bbox_patch(),
                                   connectionstyle="arc3,rad=0.2",
                                   **arrow_args))

# Finally we'll show off some more complex annotation and placement

text = ax2.annotate('xy=(0, 1)\nxycoords=("data", "axes fraction")',
                    xy=(0, 1), xycoords=("data", 'axes fraction'),
                    xytext=(0, -20), textcoords='offset points',
                    ha="center", va="top",
                    bbox=bbox_args,
                    arrowprops=arrow_args)

ax2.annotate('xy=(0.5, 0)\nxycoords=artist',
             xy=(0.5, 0.), xycoords=text,
             xytext=(0, -20), textcoords='offset points',
             ha="center", va="top",
             bbox=bbox_args,
             arrowprops=arrow_args)

ax2.annotate('xy=(0.8, 0.5)\nxycoords=ax1.transData',
             xy=(0.8, 0.5), xycoords=ax1.transData,
             xytext=(10, 10),
             textcoords=OffsetFrom(ax2.bbox, (0, 0), "points"),
             ha="left", va="bottom",
             bbox=bbox_args,
             arrowprops=arrow_args)

ax2.set(xlim=[-2, 2], ylim=[-2, 2])
plt.show()

スクリプトの合計実行時間: ( 0 分 2.463 秒)