ノート
完全なサンプルコードをダウンロードするには、ここをクリックしてください
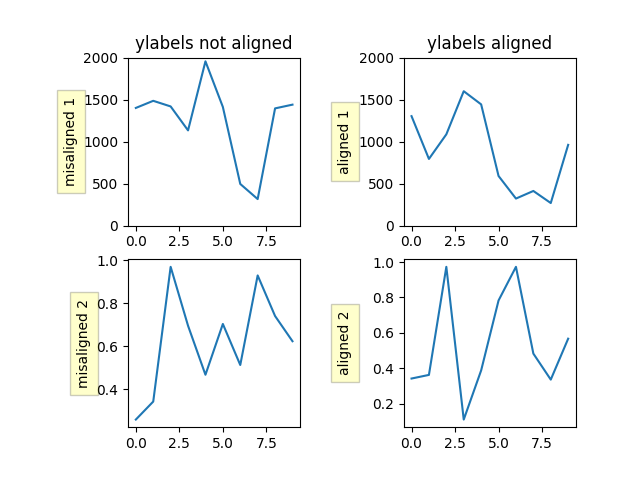
y ラベルを揃える#
ここでは 2 つの方法を示します。1 つは への短い呼び出しを使用する方法で、もう 1 つFigure.align_ylabels
はラベルを手動で揃える方法です。
import numpy as np
import matplotlib.pyplot as plt


def make_plot(axs):
    box = dict(facecolor='yellow', pad=5, alpha=0.2)

    # Fixing random state for reproducibility
    np.random.seed(19680801)
    ax1 = axs[0, 0]
    ax1.plot(2000*np.random.rand(10))
    ax1.set_title('ylabels not aligned')
    ax1.set_ylabel('misaligned 1', bbox=box)
    ax1.set_ylim(0, 2000)

    ax3 = axs[1, 0]
    ax3.set_ylabel('misaligned 2', bbox=box)
    ax3.plot(np.random.rand(10))

    ax2 = axs[0, 1]
    ax2.set_title('ylabels aligned')
    ax2.plot(2000*np.random.rand(10))
    ax2.set_ylabel('aligned 1', bbox=box)
    ax2.set_ylim(0, 2000)

    ax4 = axs[1, 1]
    ax4.plot(np.random.rand(10))
    ax4.set_ylabel('aligned 2', bbox=box)


# Plot 1:
fig, axs = plt.subplots(2, 2)
fig.subplots_adjust(left=0.2, wspace=0.6)
make_plot(axs)

# just align the last column of axes:
fig.align_ylabels(axs[:, 1])
plt.show()

こちらもご覧ください
Figure.align_ylabels同じことをFigure.align_labels行う直接的な方法。ラベルも揃える
set_label_coordsまたは、y-axis オブジェクトのメソッドを使用して、サブプロット間の軸ラベルを手動で揃えることができ
ます。これには、ハードコーディングされた適切なオフセット値を知っている必要があることに注意してください。
参考文献
この例では、次の関数、メソッド、クラス、およびモジュールの使用が示されています。
スクリプトの合計実行時間: ( 0 分 1.128 秒)