ノート
完全なサンプルコードをダウンロードするには、ここをクリックしてください
図のラベル: suptitle、supxlabel、supylabel #
各軸にはタイトル (または実際には 3 つ - それぞれloc "left"、"center"、および "right") を付けることができますがSubFigure、FigureBase.suptitle.
FigureBase.supxlabelと を使用して、Figure レベルの x ラベルと
y ラベルを追加することもできますFigureBase.supylabel。
from matplotlib.cbook import get_sample_data
import matplotlib.pyplot as plt
import numpy as np
x = np.linspace(0.0, 5.0, 501)
fig, (ax1, ax2) = plt.subplots(1, 2, constrained_layout=True, sharey=True)
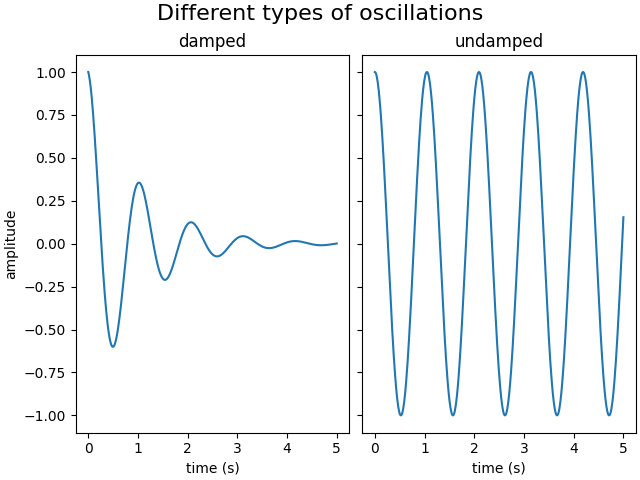
ax1.plot(x, np.cos(6*x) * np.exp(-x))
ax1.set_title('damped')
ax1.set_xlabel('time (s)')
ax1.set_ylabel('amplitude')
ax2.plot(x, np.cos(6*x))
ax2.set_xlabel('time (s)')
ax2.set_title('undamped')
fig.suptitle('Different types of oscillations', fontsize=16)
Text(0.5, 0.99131875, 'Different types of oscillations')
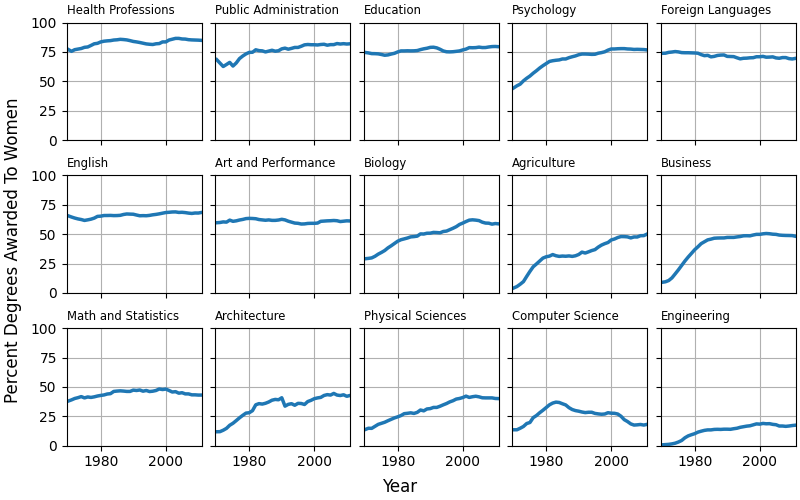
FigureBase.supxlabelおよび
メソッドを使用して、グローバルな x ラベルまたは y ラベルを設定できますFigureBase.supylabel。
fig, axs = plt.subplots(3, 5, figsize=(8, 5), constrained_layout=True,
                        sharex=True, sharey=True)

fname = get_sample_data('percent_bachelors_degrees_women_usa.csv',
                        asfileobj=False)
gender_degree_data = np.genfromtxt(fname, delimiter=',', names=True)

majors = ['Health Professions', 'Public Administration', 'Education',
          'Psychology', 'Foreign Languages', 'English',
          'Art and Performance', 'Biology',
          'Agriculture', 'Business',
          'Math and Statistics', 'Architecture', 'Physical Sciences',
          'Computer Science', 'Engineering']

for nn, ax in enumerate(axs.flat):
    ax.set_xlim(1969.5, 2011.1)
    column = majors[nn]
    column_rec_name = column.replace('\n', '_').replace(' ', '_')

    line, = ax.plot('Year', column_rec_name, data=gender_degree_data,
                    lw=2.5)
    ax.set_title(column, fontsize='small', loc='left')
    ax.set_ylim([0, 100])
    ax.grid()
fig.supxlabel('Year')
fig.supylabel('Percent Degrees Awarded To Women')

plt.show()
スクリプトの合計実行時間: ( 0 分 2.878 秒)