ノート
完全なサンプルコードをダウンロードするには、ここをクリックしてください
手動輪郭#
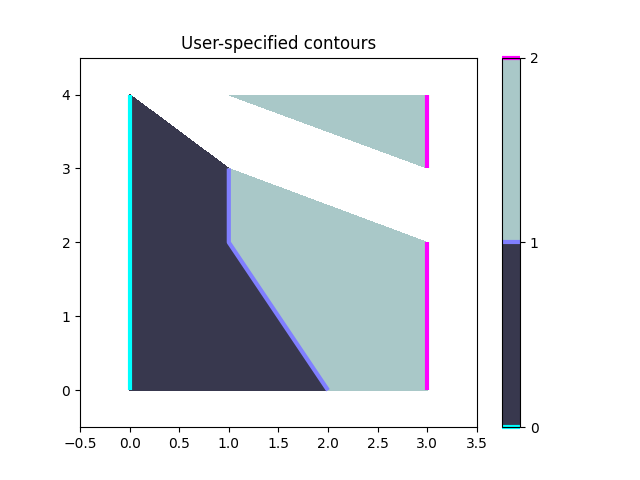
ContourSet を使用して独自の等高線とポリゴンを表示する例。
import matplotlib.pyplot as plt
from matplotlib.contour import ContourSet
import matplotlib.cm as cm
各レベルの等高線は、ポリゴンのリスト/タプルです。
2 つのレベル間の塗りつぶされた等高線も、ポリゴンのリスト/タプルです。ポイントは、時計回りまたは反時計回りに並べることができます。
fig, ax = plt.subplots()

# Filled contours using filled=True.
cs = ContourSet(ax, [0, 1, 2], [filled01, filled12], filled=True, cmap=cm.bone)
cbar = fig.colorbar(cs)

# Contour lines (non-filled).
lines = ContourSet(
    ax, [0, 1, 2], [lines0, lines1, lines2], cmap=cm.cool, linewidths=3)
cbar.add_lines(lines)

ax.set(xlim=(-0.5, 3.5), ylim=(-0.5, 4.5),
       title='User-specified contours')
[(-0.5, 3.5), (-0.5, 4.5), Text(0.5, 1.0, 'User-specified contours')]
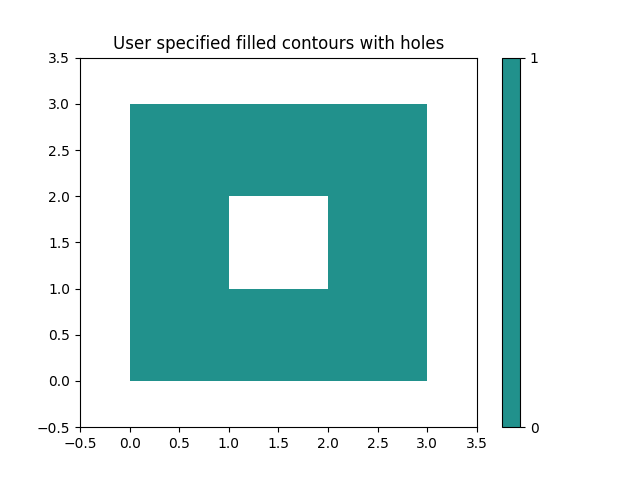
Path クラスで説明されているように、複数の塗りつぶされた等高線を、頂点の種類 (コード タイプ) のリストと共に、ポリゴン頂点の 1 つのリストで指定できます。これは、穴のあるポリゴンに特に役立ちます。ここでコード タイプ 1 は MOVETO、2 は LINETO です。
fig, ax = plt.subplots()
filled01 = [[[0, 0], [3, 0], [3, 3], [0, 3], [1, 1], [1, 2], [2, 2], [2, 1]]]
kinds01 = [[1, 2, 2, 2, 1, 2, 2, 2]]
cs = ContourSet(ax, [0, 1], [filled01], [kinds01], filled=True)
cbar = fig.colorbar(cs)

ax.set(xlim=(-0.5, 3.5), ylim=(-0.5, 3.5),
       title='User specified filled contours with holes')

plt.show()