ノート
完全なサンプルコードをダウンロードするには、ここをクリックしてください
マーカー参照番号
markerMatplotlib は、プロット コマンドのパラメーターを使用して選択されるマーカーの複数のカテゴリをサポートします。
すべてのマーカーのリストについては、matplotlib.markersドキュメントも参照してください。
使用例については、マーカーの例を参照してください 。
from matplotlib.markers import MarkerStyle
import matplotlib.pyplot as plt
from matplotlib.lines import Line2D
from matplotlib.transforms import Affine2D


text_style = dict(horizontalalignment='right', verticalalignment='center',
                  fontsize=12, fontfamily='monospace')
marker_style = dict(linestyle=':', color='0.8', markersize=10,
                    markerfacecolor="tab:blue", markeredgecolor="tab:blue")


def format_axes(ax):
    ax.margins(0.2)
    ax.set_axis_off()
    ax.invert_yaxis()


def split_list(a_list):
    i_half = len(a_list) // 2
    return a_list[:i_half], a_list[i_half:]
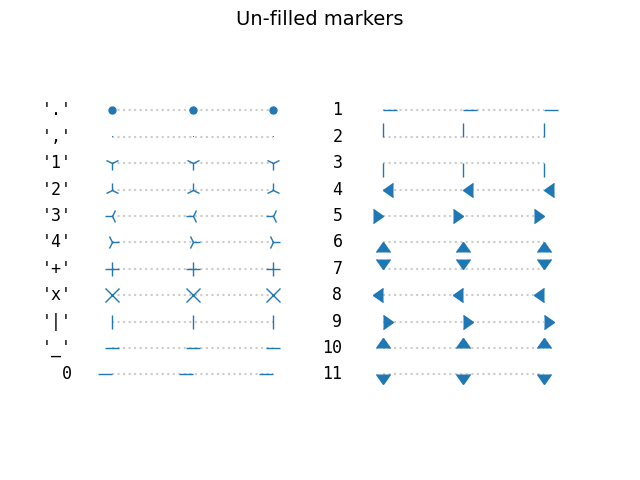
塗りつぶされていないマーカー#
塗りつぶされていないマーカーは単色です。
fig, axs = plt.subplots(ncols=2)
fig.suptitle('Un-filled markers', fontsize=14)

# Filter out filled markers and marker settings that do nothing.
unfilled_markers = [m for m, func in Line2D.markers.items()
                    if func != 'nothing' and m not in Line2D.filled_markers]

for ax, markers in zip(axs, split_list(unfilled_markers)):
    for y, marker in enumerate(markers):
        ax.text(-0.5, y, repr(marker), **text_style)
        ax.plot([y] * 3, marker=marker, **marker_style)
    format_axes(ax)

plt.show()
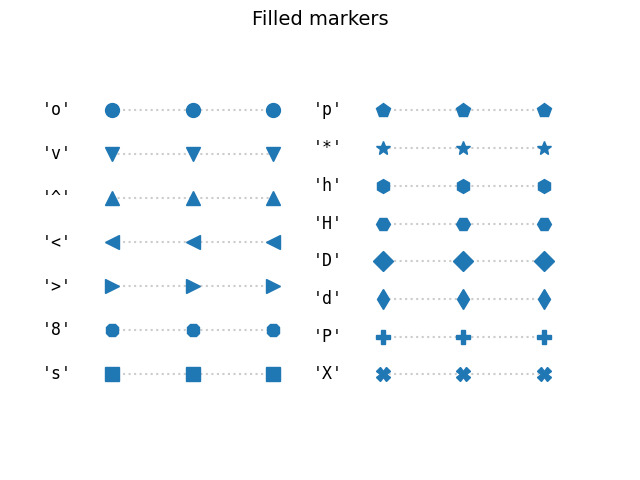
塗りつぶされたマーカー#
fig, axs = plt.subplots(ncols=2)
fig.suptitle('Filled markers', fontsize=14)
for ax, markers in zip(axs, split_list(Line2D.filled_markers)):
    for y, marker in enumerate(markers):
        ax.text(-0.5, y, repr(marker), **text_style)
        ax.plot([y] * 3, marker=marker, **marker_style)
    format_axes(ax)

plt.show()
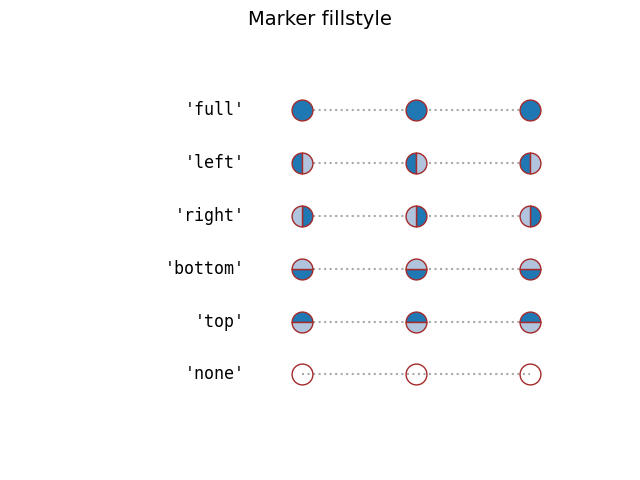
マーカーの塗りつぶしスタイル#
塗りつぶしマーカーのエッジの色と塗りつぶしの色を個別に指定できます。さらに、fillstyleさまざまな方向で非充填、完全充填、または半充填に設定できます。半分塗りつぶされたスタイルは
markerfacecoloralt、2 番目の塗りつぶしの色として使用されます。
fig, ax = plt.subplots()
fig.suptitle('Marker fillstyle', fontsize=14)
fig.subplots_adjust(left=0.4)

filled_marker_style = dict(marker='o', linestyle=':', markersize=15,
                           color='darkgrey',
                           markerfacecolor='tab:blue',
                           markerfacecoloralt='lightsteelblue',
                           markeredgecolor='brown')

for y, fill_style in enumerate(Line2D.fillStyles):
    ax.text(-0.5, y, repr(fill_style), **text_style)
    ax.plot([y] * 3, fillstyle=fill_style, **filled_marker_style)
format_axes(ax)

plt.show()
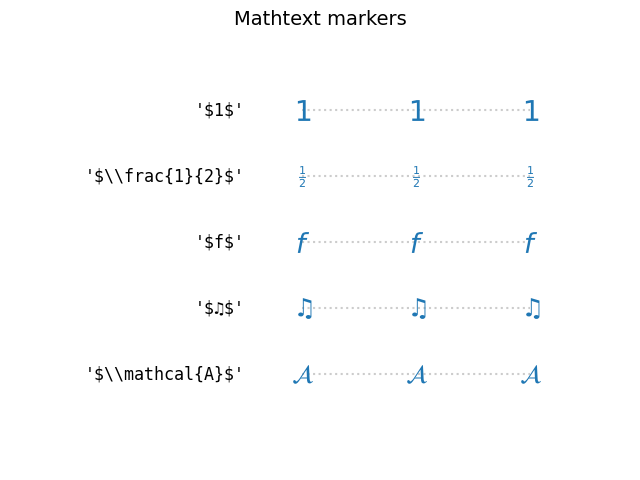
TeX シンボルから作成されたマーカー#
などのカスタム マーカー シンボルを使用するには、MathTextを"$\u266B$"使用します。STIX フォント記号の概要については、STIX フォント表を参照してください。STIX フォントも参照してください。
fig, ax = plt.subplots()
fig.suptitle('Mathtext markers', fontsize=14)
fig.subplots_adjust(left=0.4)

marker_style.update(markeredgecolor="none", markersize=15)
markers = ["$1$", r"$\frac{1}{2}$", "$f$", "$\u266B$", r"$\mathcal{A}$"]

for y, marker in enumerate(markers):
    # Escape dollars so that the text is written "as is", not as mathtext.
    ax.text(-0.5, y, repr(marker).replace("$", r"\$"), **text_style)
    ax.plot([y] * 3, marker=marker, **marker_style)
format_axes(ax)

plt.show()
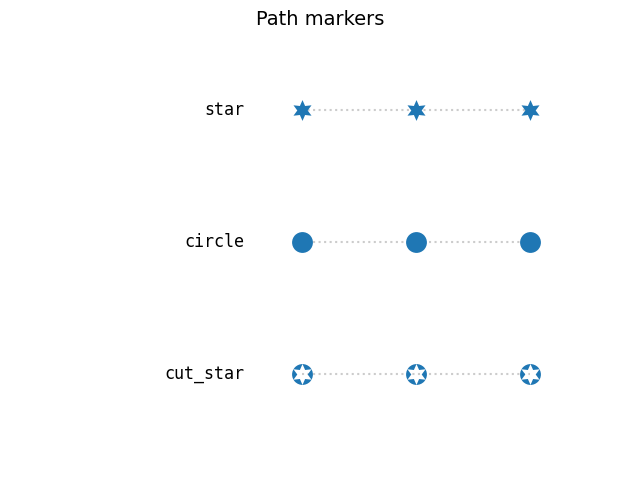
パスから作成されたマーカー#
いずれPathもマーカーとして使用できます。次の例は、 starとcircleの 2 つの単純なパスと、星を切り取った円のより複雑なパスを示しています。
import matplotlib.path as mpath
import numpy as np

star = mpath.Path.unit_regular_star(6)
circle = mpath.Path.unit_circle()
# concatenate the circle with an internal cutout of the star
cut_star = mpath.Path(
    vertices=np.concatenate([circle.vertices, star.vertices[::-1, ...]]),
    codes=np.concatenate([circle.codes, star.codes]))

fig, ax = plt.subplots()
fig.suptitle('Path markers', fontsize=14)
fig.subplots_adjust(left=0.4)

markers = {'star': star, 'circle': circle, 'cut_star': cut_star}

for y, (name, marker) in enumerate(markers.items()):
    ax.text(-0.5, y, name, **text_style)
    ax.plot([y] * 3, marker=marker, **marker_style)
format_axes(ax)

plt.show()
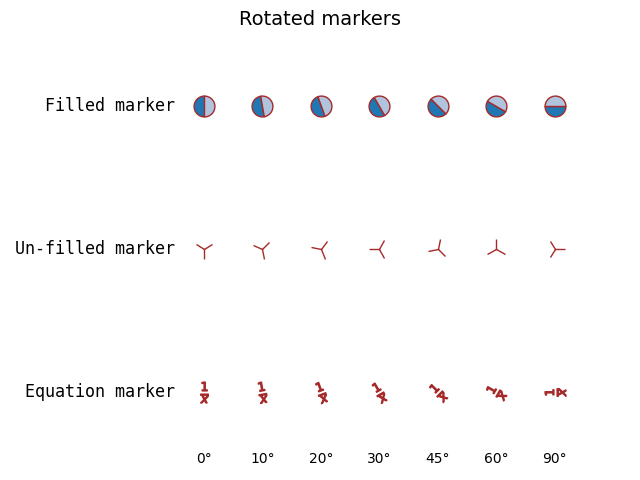
トランスフォームによるマーカーの高度な変更#
マーカーは、変換を MarkerStyle コンストラクターに渡すことで変更できます。次の例は、指定された回転が複数のマーカー形状にどのように適用されるかを示しています。
common_style = {k: v for k, v in filled_marker_style.items() if k != 'marker'}
angles = [0, 10, 20, 30, 45, 60, 90]

fig, ax = plt.subplots()
fig.suptitle('Rotated markers', fontsize=14)

ax.text(-0.5, 0, 'Filled marker', **text_style)
for x, theta in enumerate(angles):
    t = Affine2D().rotate_deg(theta)
    ax.plot(x, 0, marker=MarkerStyle('o', 'left', t), **common_style)

ax.text(-0.5, 1, 'Un-filled marker', **text_style)
for x, theta in enumerate(angles):
    t = Affine2D().rotate_deg(theta)
    ax.plot(x, 1, marker=MarkerStyle('1', 'left', t), **common_style)

ax.text(-0.5, 2, 'Equation marker', **text_style)
for x, theta in enumerate(angles):
    t = Affine2D().rotate_deg(theta)
    eq = r'$\frac{1}{x}$'
    ax.plot(x, 2, marker=MarkerStyle(eq, 'left', t), **common_style)

for x, theta in enumerate(angles):
    ax.text(x, 2.5, f"{theta}°", horizontalalignment="center")
format_axes(ax)

fig.tight_layout()
plt.show()
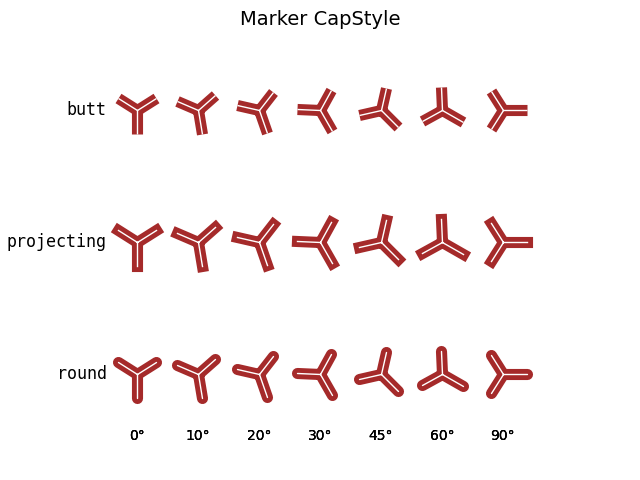
マーカー キャップ スタイルと結合スタイルの設定#
マーカーにはデフォルトのキャップ スタイルと結合スタイルがありますが、これらは MarkerStyle の作成時にカスタマイズできます。
from matplotlib.markers import JoinStyle, CapStyle

marker_inner = dict(markersize=35,
                    markerfacecolor='tab:blue',
                    markerfacecoloralt='lightsteelblue',
                    markeredgecolor='brown',
                    markeredgewidth=8,
                    )

marker_outer = dict(markersize=35,
                    markerfacecolor='tab:blue',
                    markerfacecoloralt='lightsteelblue',
                    markeredgecolor='white',
                    markeredgewidth=1,
                    )

fig, ax = plt.subplots()
fig.suptitle('Marker CapStyle', fontsize=14)
fig.subplots_adjust(left=0.1)

for y, cap_style in enumerate(CapStyle):
    ax.text(-0.5, y, cap_style.name, **text_style)
    for x, theta in enumerate(angles):
        t = Affine2D().rotate_deg(theta)
        m = MarkerStyle('1', transform=t, capstyle=cap_style)
        ax.plot(x, y, marker=m, **marker_inner)
        ax.plot(x, y, marker=m, **marker_outer)
        ax.text(x, len(CapStyle) - .5, f'{theta}°', ha='center')
format_axes(ax)
plt.show()
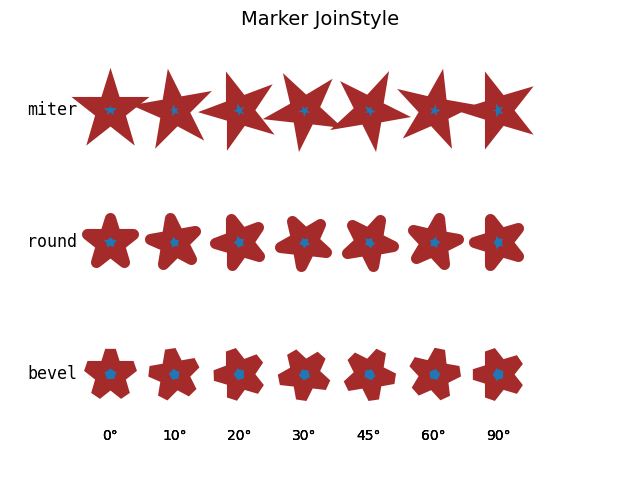
結合スタイルの変更:
fig, ax = plt.subplots()
fig.suptitle('Marker JoinStyle', fontsize=14)
fig.subplots_adjust(left=0.05)

for y, join_style in enumerate(JoinStyle):
    ax.text(-0.5, y, join_style.name, **text_style)
    for x, theta in enumerate(angles):
        t = Affine2D().rotate_deg(theta)
        m = MarkerStyle('*', transform=t, joinstyle=join_style)
        ax.plot(x, y, marker=m, **marker_inner)
        ax.text(x, len(JoinStyle) - .5, f'{theta}°', ha='center')
format_axes(ax)

plt.show()
スクリプトの合計実行時間: ( 0 分 2.550 秒)