ノート
完全なサンプルコードをダウンロードするには、ここをクリックしてください
#付きのカラーバーAxesDivider
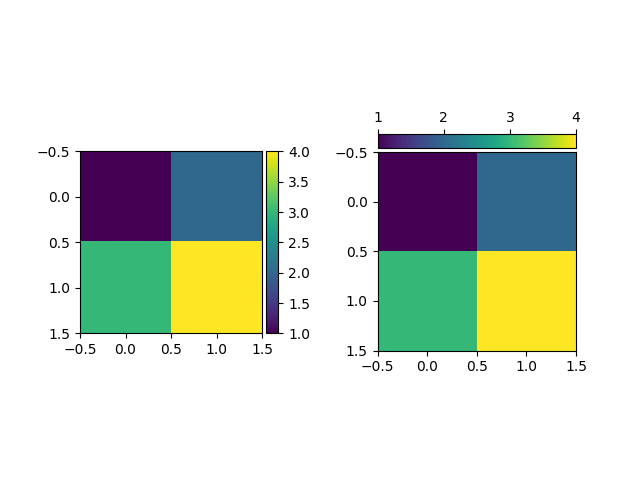
このaxes_divider.make_axes_locatable関数は、既存の軸を受け取り、それを新しい軸に追加して、AxesDividerを返しますAxesDivider。のappend_axes
メソッドをAxesDivider使用して、元の軸の特定の側 (「上」、「右」、「下」、または「左」) に新しい軸を作成できます。この例ではappend_axes、軸の横にカラー バーを追加するために使用します。

import matplotlib.pyplot as plt
from mpl_toolkits.axes_grid1.axes_divider import make_axes_locatable

fig, (ax1, ax2) = plt.subplots(1, 2)
fig.subplots_adjust(wspace=0.5)

im1 = ax1.imshow([[1, 2], [3, 4]])
ax1_divider = make_axes_locatable(ax1)
# Add an Axes to the right of the main Axes.
cax1 = ax1_divider.append_axes("right", size="7%", pad="2%")
cb1 = fig.colorbar(im1, cax=cax1)

im2 = ax2.imshow([[1, 2], [3, 4]])
ax2_divider = make_axes_locatable(ax2)
# Add an Axes above the main Axes.
cax2 = ax2_divider.append_axes("top", size="7%", pad="2%")
cb2 = fig.colorbar(im2, cax=cax2, orientation="horizontal")
# Change tick position to top (with the default tick position "bottom", ticks
# overlap the image).
cax2.xaxis.set_ticks_position("top")

plt.show()