ノート
完全なサンプルコードをダウンロードするには、ここをクリックしてください
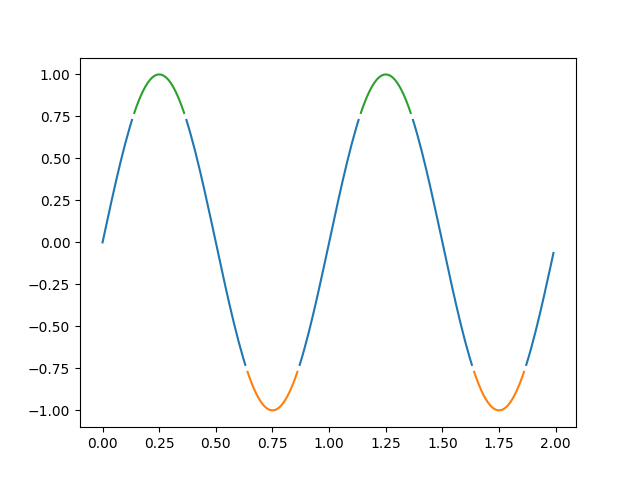
y 値による色付け#
マスクされた配列を使用して、y 値ごとに異なる色のラインをプロットします。
import numpy as np
import matplotlib.pyplot as plt

t = np.arange(0.0, 2.0, 0.01)
s = np.sin(2 * np.pi * t)

upper = 0.77
lower = -0.77

supper = np.ma.masked_where(s < upper, s)
slower = np.ma.masked_where(s > lower, s)
smiddle = np.ma.masked_where((s < lower) | (s > upper), s)

fig, ax = plt.subplots()
ax.plot(t, smiddle, t, slower, t, supper)
plt.show()