ノート
完全なサンプルコードをダウンロードするには、ここをクリックしてください
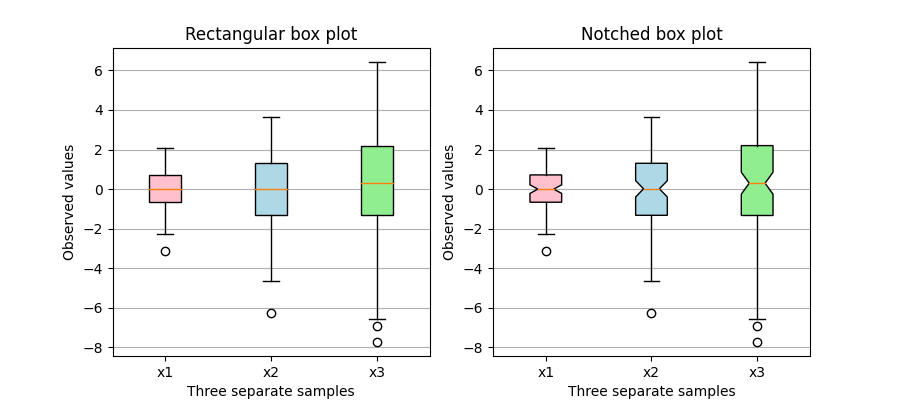
カスタム塗りつぶし色の箱ひげ図#
このプロットは、2 種類のボックス プロット (長方形とノッチ付き) を作成する方法と、ボックス プロットのアーティストのプロパティにアクセスしてカスタム カラーで塗りつぶす方法を示しています。さらに、labelsパラメーターは、各サンプルの x-tick ラベルを提供するために使用されます。
箱ひげ図とその歴史に関する一般的なリファレンスは、 http ://vita.had.co.nz/papers/boxplots.pdf にあります。
import matplotlib.pyplot as plt
import numpy as np

# Random test data
np.random.seed(19680801)
all_data = [np.random.normal(0, std, size=100) for std in range(1, 4)]
labels = ['x1', 'x2', 'x3']

fig, (ax1, ax2) = plt.subplots(nrows=1, ncols=2, figsize=(9, 4))

# rectangular box plot
bplot1 = ax1.boxplot(all_data,
                     vert=True,  # vertical box alignment
                     patch_artist=True,  # fill with color
                     labels=labels)  # will be used to label x-ticks
ax1.set_title('Rectangular box plot')

# notch shape box plot
bplot2 = ax2.boxplot(all_data,
                     notch=True,  # notch shape
                     vert=True,  # vertical box alignment
                     patch_artist=True,  # fill with color
                     labels=labels)  # will be used to label x-ticks
ax2.set_title('Notched box plot')

# fill with colors
colors = ['pink', 'lightblue', 'lightgreen']
for bplot in (bplot1, bplot2):
    for patch, color in zip(bplot['boxes'], colors):
        patch.set_facecolor(color)

# adding horizontal grid lines
for ax in [ax1, ax2]:
    ax.yaxis.grid(True)
    ax.set_xlabel('Three separate samples')
    ax.set_ylabel('Observed values')

plt.show()
参考文献
この例では、次の関数、メソッド、クラス、およびモジュールの使用が示されています。