ノート
完全なサンプルコードをダウンロードするには、ここをクリックしてください
高度な quiver および quiverkey 関数#
のより高度なオプションをいくつか示しますquiver。簡単な例については、Quiver Simple Demoを参照してください。
注: プロットの自動スケーリングでは矢印が考慮されないため、境界線上にある矢印が画像の外に出る場合があります。これは、完全に一般的な方法で解決するのは簡単な問題ではありません。このような場合に推奨される回避策は、軸の制限を手動で設定することです。
fig1, ax1 = plt.subplots()
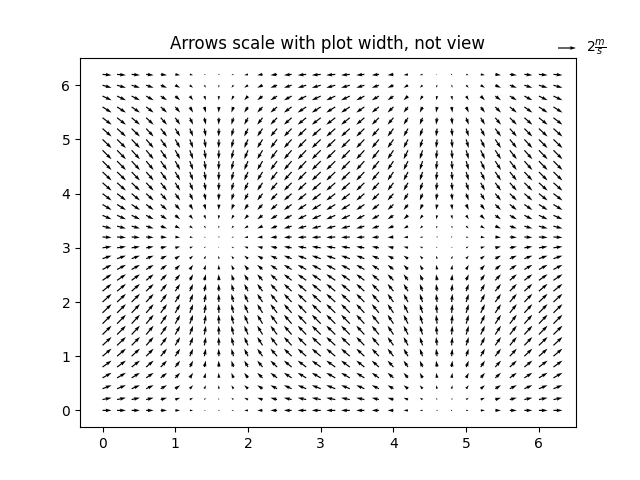
ax1.set_title('Arrows scale with plot width, not view')
Q = ax1.quiver(X, Y, U, V, units='width')
qk = ax1.quiverkey(Q, 0.9, 0.9, 2, r'$2 \frac{m}{s}$', labelpos='E',
                   coordinates='figure')

fig2, ax2 = plt.subplots()
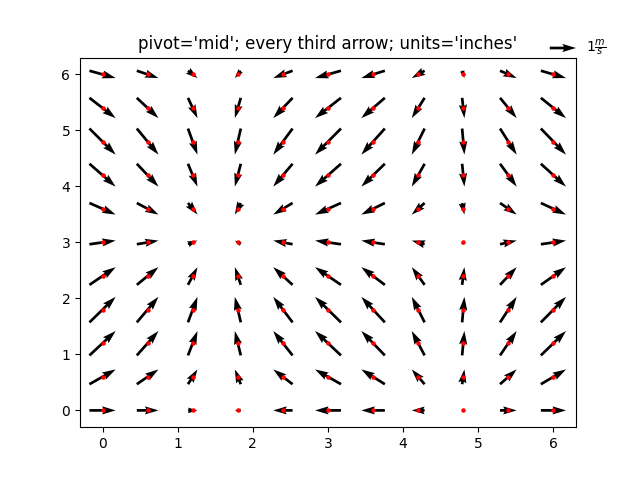
ax2.set_title("pivot='mid'; every third arrow; units='inches'")
Q = ax2.quiver(X[::3, ::3], Y[::3, ::3], U[::3, ::3], V[::3, ::3],
               pivot='mid', units='inches')
qk = ax2.quiverkey(Q, 0.9, 0.9, 1, r'$1 \frac{m}{s}$', labelpos='E',
                   coordinates='figure')
ax2.scatter(X[::3, ::3], Y[::3, ::3], color='r', s=5)

<matplotlib.collections.PathCollection object at 0x7f2cfad10ac0>
fig3, ax3 = plt.subplots()
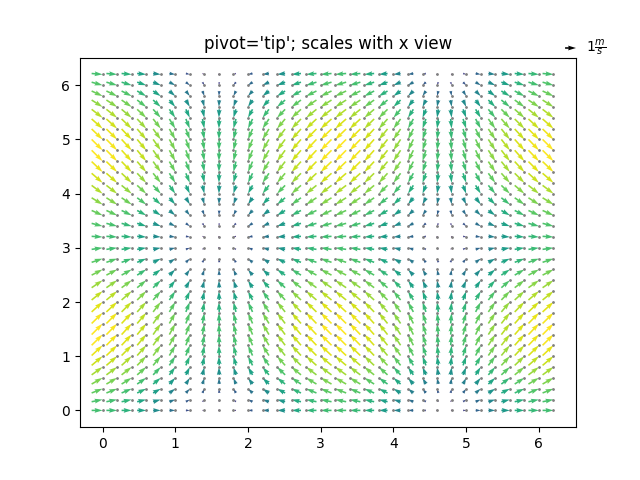
ax3.set_title("pivot='tip'; scales with x view")
M = np.hypot(U, V)
Q = ax3.quiver(X, Y, U, V, M, units='x', pivot='tip', width=0.022,
               scale=1 / 0.15)
qk = ax3.quiverkey(Q, 0.9, 0.9, 1, r'$1 \frac{m}{s}$', labelpos='E',
                   coordinates='figure')
ax3.scatter(X, Y, color='0.5', s=1)

plt.show()

参考文献
この例では、次の関数、メソッド、クラス、およびモジュールの使用が示されています。
スクリプトの合計実行時間: ( 0 分 1.864 秒)