ノート
完全なサンプルコードをダウンロードするには、ここをクリックしてください
カラーバーの目盛りラベリング#
カラーバーのカスタム ラベルを生成します。
スコット・シンクレアによる寄稿
import matplotlib.pyplot as plt
import numpy as np
from matplotlib import cm
from numpy.random import randn


# Fixing random state for reproducibility
np.random.seed(19680801)
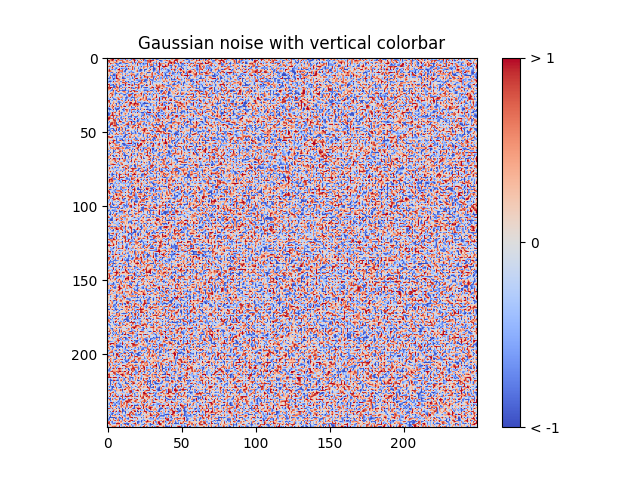
垂直 (デフォルト) カラーバーでプロットを作成
fig, ax = plt.subplots()

data = np.clip(randn(250, 250), -1, 1)

cax = ax.imshow(data, cmap=cm.coolwarm)
ax.set_title('Gaussian noise with vertical colorbar')

# Add colorbar, make sure to specify tick locations to match desired ticklabels
cbar = fig.colorbar(cax, ticks=[-1, 0, 1])
cbar.ax.set_yticklabels(['< -1', '0', '> 1'])  # vertically oriented colorbar
[Text(1, -1, '< -1'), Text(1, 0, '0'), Text(1, 1, '> 1')]
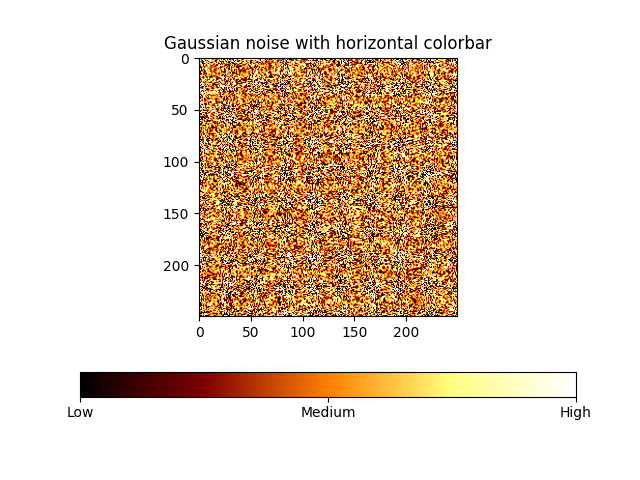
水平カラーバーでプロットを作成
fig, ax = plt.subplots()

data = np.clip(randn(250, 250), -1, 1)

cax = ax.imshow(data, cmap=cm.afmhot)
ax.set_title('Gaussian noise with horizontal colorbar')

cbar = fig.colorbar(cax, ticks=[-1, 0, 1], orientation='horizontal')
cbar.ax.set_xticklabels(['Low', 'Medium', 'High'])  # horizontal colorbar

plt.show()
スクリプトの合計実行時間: ( 0 分 1.182 秒)