ノート
完全なサンプルコードをダウンロードするには、ここをクリックしてください
パイプロットテキスト#
import numpy as np
import matplotlib.pyplot as plt
# Fixing random state for reproducibility
np.random.seed(19680801)
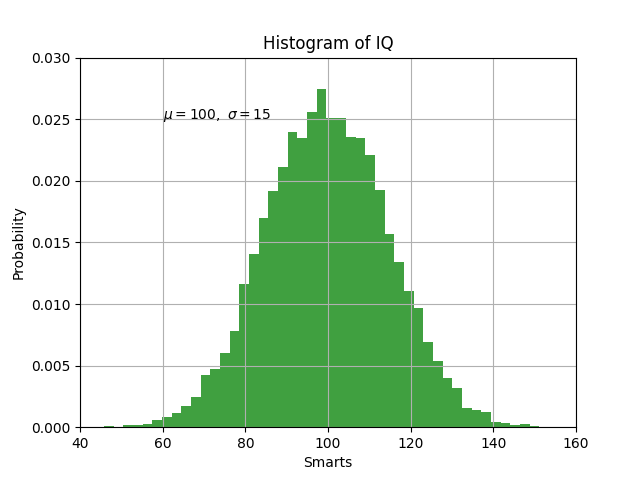
mu, sigma = 100, 15
x = mu + sigma * np.random.randn(10000)
# the histogram of the data
n, bins, patches = plt.hist(x, 50, density=True, facecolor='g', alpha=0.75)
plt.xlabel('Smarts')
plt.ylabel('Probability')
plt.title('Histogram of IQ')
plt.text(60, .025, r'$\mu=100,\ \sigma=15$')
plt.xlim(40, 160)
plt.ylim(0, 0.03)
plt.grid(True)
plt.show()
参考文献
この例では、次の関数、メソッド、クラス、およびモジュールの使用が示されています。