ノート
完全なサンプルコードをダウンロードするには、ここをクリックしてください
デフォルトの目盛りフォーマッタ#
この例はScalarFormatter、さまざまな設定でのデフォルトの使用を示しています。
例 1 : デフォルト
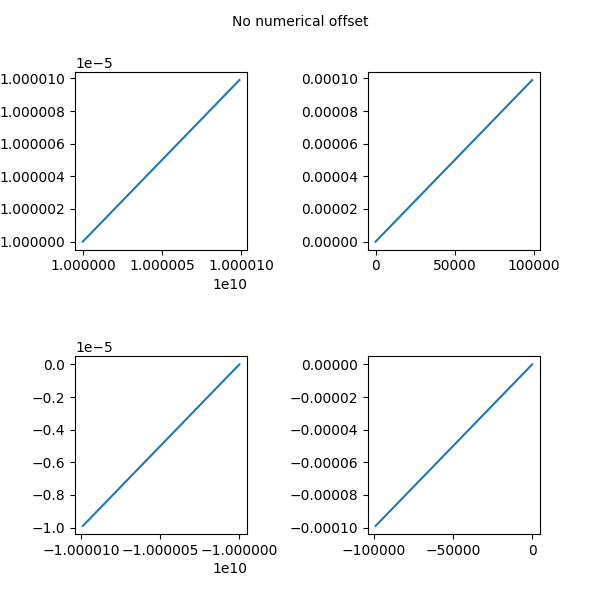
例 2 : 数値オフセットなし
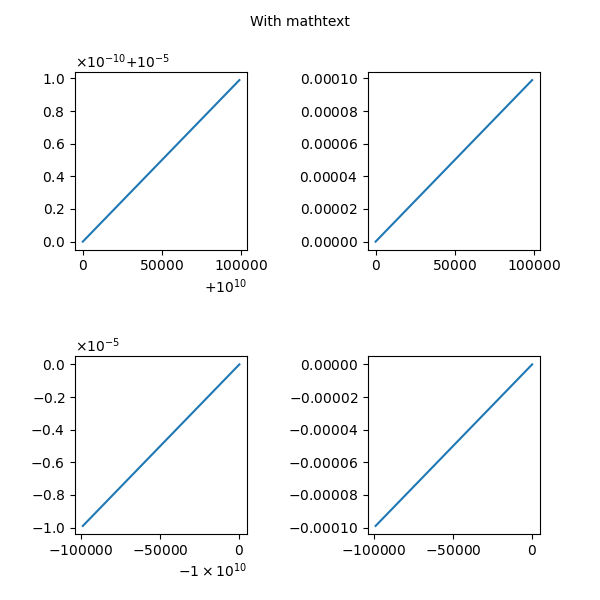
例 3 : Mathtext を使用
import matplotlib.pyplot as plt
import numpy as np
例 1
x = np.arange(0, 1, .01)
fig, [[ax1, ax2], [ax3, ax4]] = plt.subplots(2, 2, figsize=(6, 6))
fig.text(0.5, 0.975, 'Default settings',
         horizontalalignment='center',
         verticalalignment='top')

ax1.plot(x * 1e5 + 1e10, x * 1e-10 + 1e-5)

ax2.plot(x * 1e5, x * 1e-4)

ax3.plot(-x * 1e5 - 1e10, -x * 1e-5 - 1e-10)

ax4.plot(-x * 1e5, -x * 1e-4)

fig.subplots_adjust(wspace=0.7, hspace=0.6)

例 2
x = np.arange(0, 1, .01)
fig, [[ax1, ax2], [ax3, ax4]] = plt.subplots(2, 2, figsize=(6, 6))
fig.text(0.5, 0.975, 'No numerical offset',
         horizontalalignment='center',
         verticalalignment='top')

ax1.plot(x * 1e5 + 1e10, x * 1e-10 + 1e-5)
ax1.ticklabel_format(useOffset=False)

ax2.plot(x * 1e5, x * 1e-4)
ax2.ticklabel_format(useOffset=False)

ax3.plot(-x * 1e5 - 1e10, -x * 1e-5 - 1e-10)
ax3.ticklabel_format(useOffset=False)

ax4.plot(-x * 1e5, -x * 1e-4)
ax4.ticklabel_format(useOffset=False)

fig.subplots_adjust(wspace=0.7, hspace=0.6)
例 3
x = np.arange(0, 1, .01)
fig, [[ax1, ax2], [ax3, ax4]] = plt.subplots(2, 2, figsize=(6, 6))
fig.text(0.5, 0.975, 'With mathtext',
         horizontalalignment='center',
         verticalalignment='top')

ax1.plot(x * 1e5 + 1e10, x * 1e-10 + 1e-5)
ax1.ticklabel_format(useMathText=True)

ax2.plot(x * 1e5, x * 1e-4)
ax2.ticklabel_format(useMathText=True)

ax3.plot(-x * 1e5 - 1e10, -x * 1e-5 - 1e-10)
ax3.ticklabel_format(useMathText=True)

ax4.plot(-x * 1e5, -x * 1e-4)
ax4.ticklabel_format(useMathText=True)

fig.subplots_adjust(wspace=0.7, hspace=0.6)

plt.show()
スクリプトの合計実行時間: ( 0 分 1.866 秒)