ノート
完全なサンプルコードをダウンロードするには、ここをクリックしてください
Rc番号をカスタマイズ
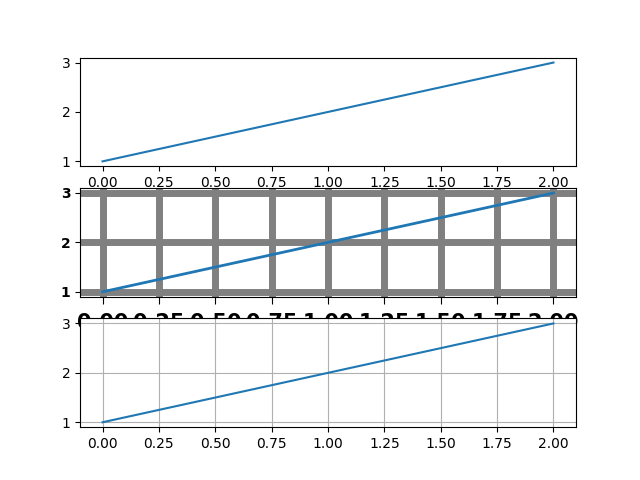
ここでは見栄えの良いフィギュアを作ろうとしているわけではありませんが、rcParamsその場でカスタマイズする例をいくつか示しています。
対話的に作業するのが好きで、Figure のさまざまな既定のセットを作成する必要がある場合 (たとえば、公開用に 1 つの既定のセット、対話型の調査用に 1 つの既定のセット)、既定を設定するカスタム モジュールでいくつかの関数を定義することができます。例えば、:
def set_pub():
    rcParams.update({
        "font.weight": "bold",  # bold fonts
        "tick.labelsize": 15,   # large tick labels
        "lines.linewidth": 1,   # thick lines
        "lines.color": "k",     # black lines
        "grid.color": "0.5",    # gray gridlines
        "grid.linestyle": "-",  # solid gridlines
        "grid.linewidth": 0.5,  # thin gridlines
        "savefig.dpi": 300,     # higher resolution output.
    })
次に、インタラクティブに作業しているので、次のことを行う必要があります。
>>> set_pub()
>>> plot([1, 2, 3])
>>> savefig('myfig')
>>> rcdefaults()  # restore the defaults

import matplotlib.pyplot as plt

plt.subplot(311)
plt.plot([1, 2, 3])

# the axes attributes need to be set before the call to subplot
plt.rcParams.update({
    "font.weight": "bold",
    "xtick.major.size": 5,
    "xtick.major.pad": 7,
    "xtick.labelsize": 15,
    "grid.color": "0.5",
    "grid.linestyle": "-",
    "grid.linewidth": 5,
    "lines.linewidth": 2,
    "lines.color": "g",
})
plt.subplot(312)
plt.plot([1, 2, 3])
plt.grid(True)

plt.rcdefaults()
plt.subplot(313)
plt.plot([1, 2, 3])
plt.grid(True)
plt.show()