ノート
完全なサンプルコードをダウンロードするには、ここをクリックしてください
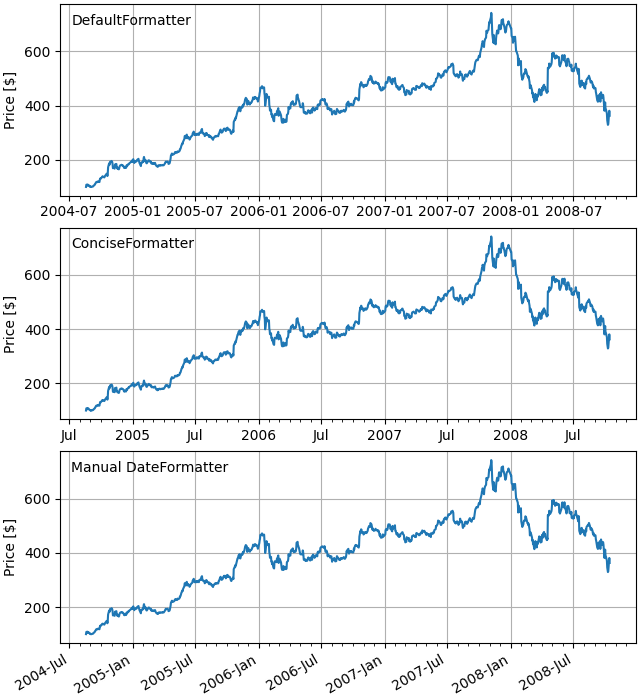
日付の目盛りラベル#
Matplotlib の日付プロットは、日付インスタンスをエポック (デフォルトでは 1970-01-01T00:00:00) からの日数に変換することによって行われます。この
matplotlib.datesモジュールはコンバーター関数date2num
を提供し、
オブジェクトを Matplotlib の内部表現との間num2dateで変換datetime.datetimeします。numpy.datetime64これらのデータ型は、 で説明されている単位変換メカニズムに登録されている
matplotlib.unitsため、変換はユーザーに対して自動的に行われます。登録プロセスでは、軸のデフォルトの目盛りlocatorおよび
もおよび
に設定されます。formatterAutoDateLocatorAutoDateFormatter
別のフォーマッタは で、下ConciseDateFormatterの 2 番目で使用されAxesます (
ConciseDateFormatter を使用して日付ティックをフォーマットするを参照)。これにより、多くの場合、ティック ラベルを回転する必要がなくなります。最後は、 に記載されている書式文字列を使用して日付を書式設定するためにAxes、日付を手動で
書式設定します。DateFormatterdatetime.date.strftime
import matplotlib.pyplot as plt
import matplotlib.dates as mdates
import matplotlib.cbook as cbook

# Load a numpy record array from yahoo csv data with fields date, open, high,
# low, close, volume, adj_close from the mpl-data/sample_data directory. The
# record array stores the date as an np.datetime64 with a day unit ('D') in
# the date column.
data = cbook.get_sample_data('goog.npz', np_load=True)['price_data']

fig, axs = plt.subplots(3, 1, figsize=(6.4, 7), constrained_layout=True)
# common to all three:
for ax in axs:
    ax.plot('date', 'adj_close', data=data)
    # Major ticks every half year, minor ticks every month,
    ax.xaxis.set_major_locator(mdates.MonthLocator(bymonth=(1, 7)))
    ax.xaxis.set_minor_locator(mdates.MonthLocator())
    ax.grid(True)
    ax.set_ylabel(r'Price [\$]')

# different formats:
ax = axs[0]
ax.set_title('DefaultFormatter', loc='left', y=0.85, x=0.02, fontsize='medium')

ax = axs[1]
ax.set_title('ConciseFormatter', loc='left', y=0.85, x=0.02, fontsize='medium')
ax.xaxis.set_major_formatter(
    mdates.ConciseDateFormatter(ax.xaxis.get_major_locator()))

ax = axs[2]
ax.set_title('Manual DateFormatter', loc='left', y=0.85, x=0.02,
             fontsize='medium')
# Text in the x axis will be displayed in 'YYYY-mm' format.
ax.xaxis.set_major_formatter(mdates.DateFormatter('%Y-%b'))
# Rotates and right-aligns the x labels so they don't crowd each other.
for label in ax.get_xticklabels(which='major'):
    label.set(rotation=30, horizontalalignment='right')

plt.show()
スクリプトの合計実行時間: ( 0 分 1.408 秒)