ノート
完全なサンプルコードをダウンロードするには、ここをクリックしてください
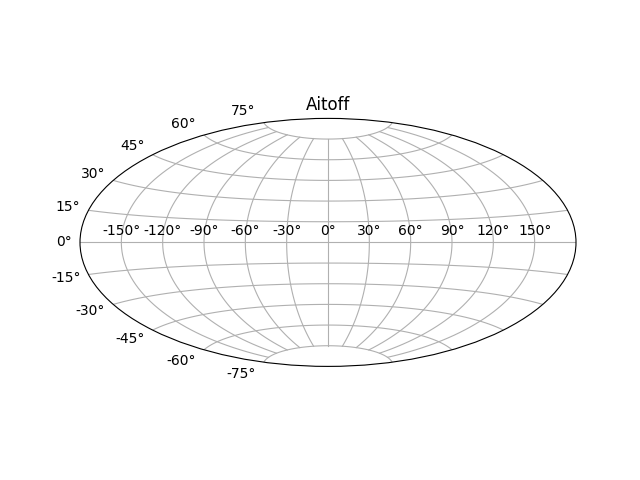
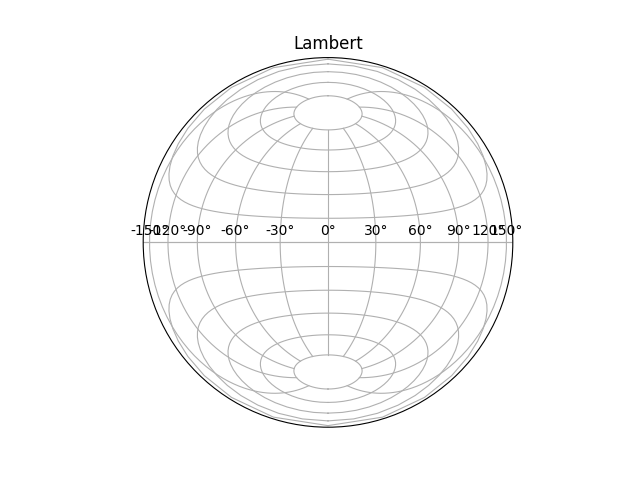
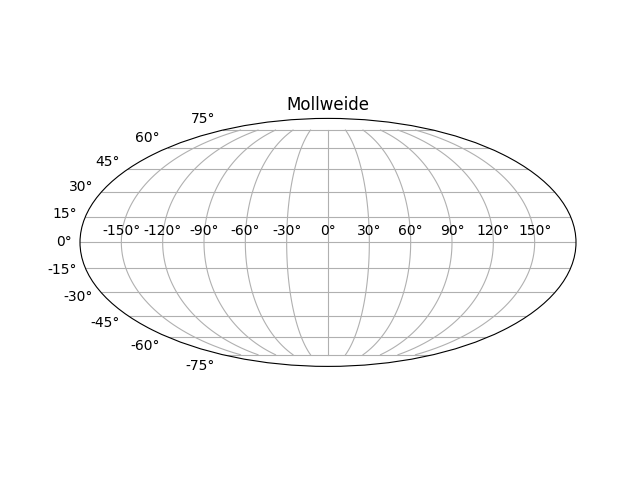
地理的予測#
これは、4 つの可能な地理的投影を示しています。Cartopyは、より多くのプロジェクションをサポートしています。
import matplotlib.pyplot as plt
plt.figure()
plt.subplot(projection="aitoff")
plt.title("Aitoff")
plt.grid(True)
plt.figure()
plt.subplot(projection="hammer")
plt.title("Hammer")
plt.grid(True)

plt.figure()
plt.subplot(projection="lambert")
plt.title("Lambert")
plt.grid(True)
plt.figure()
plt.subplot(projection="mollweide")
plt.title("Mollweide")
plt.grid(True)

plt.show()
スクリプトの合計実行時間: ( 0 分 1.707 秒)