ノート
完全なサンプルコードをダウンロードするには、ここをクリックしてください
スケール不変角度ラベル#
この例では、スケール不変の角度注釈を作成する方法を示します。線の間の角度や形状の内側を円弧でマークすると便利なことがよくあります。Matplotlib は を提供しArcますが、そのような目的で直接使用する場合の固有の問題は、データ空間で円形である円弧が表示空間で必ずしも円形ではないということです。また、円弧の半径は、多くの場合、実際のデータ座標とは独立した座標系で定義するのが最適です。少なくとも、注釈が無限に大きくなることなくプロットを自由にズームできるようにしたい場合は。
これには、円弧の中心がデータ空間で定義されるソリューションが必要ですが、その半径はポイントやピクセルなどの物理単位で、または Axes 次元の比率として定義されます。次のAngleAnnotationクラスは、そのようなソリューションを提供します。
以下の例は、次の 2 つの目的に役立ちます。
グラフで角度を簡単に描画するという問題に対して、すぐに使用できるソリューションを提供します。
Matplotlib アーティストをサブクラス化してその機能を強化する方法と、Matplotlib の変換システムの使用方法に関する実践的な例を示します。
主に前者に興味がある場合は、以下のクラスをコピーして、使用法セクションにジャンプしてください。
アングルアノテーションクラス#
ここでの基本的な考え方は、サブクラスArc化してその変換を に設定しIdentityTransform、円弧のパラメータをピクセル空間で定義することです。Arc次に、の属性_center、theta1、
theta2、widthおよびをオーバーライドし、heightそれらをプロパティにして、属性にアクセスするたびにそれぞれのパラメーターを計算する内部メソッドに結合し、ピクセル空間のアークが入力ポイントおよびサイズと同期したままになるようにします。たとえば、アークの描画メソッドがその_center
属性を照会するたびに、同じ番号を何度も受け取るのではなくget_center_in_pixels、サブクラスで定義したメソッドの結果を受け取ります。このメソッドは、Axes 変換を介してデータ座標の中心をピクセルに変換しますax.transData. サイズと角度は同様の方法で計算され、ズームやインタラクティブなパンなどで円弧の形状が自動的に変化します。
このクラスの機能により、アークにテキストで注釈を付けることができます。このテキストはAnnotation属性に保存されますtext。円弧の位置と半径は描画時にのみ定義されるため、それに応じてテキストの位置を更新する必要があります。これは、Arcの
draw()メソッドを再実装して、テキストの更新メソッドを呼び出せるようにすることによって行われます。
円弧とテキストは、インスタンス化時に提供された Axes に追加されます。したがって、それへの参照を保持する必要は厳密にはありません。
import numpy as np
import matplotlib.pyplot as plt
from matplotlib.patches import Arc
from matplotlib.transforms import IdentityTransform, TransformedBbox, Bbox


class AngleAnnotation(Arc):
    """
    Draws an arc between two vectors which appears circular in display space.
    """
    def __init__(self, xy, p1, p2, size=75, unit="points", ax=None,
                 text="", textposition="inside", text_kw=None, **kwargs):
        """
        Parameters
        ----------
        xy, p1, p2 : tuple or array of two floats
            Center position and two points. Angle annotation is drawn between
            the two vectors connecting *p1* and *p2* with *xy*, respectively.
            Units are data coordinates.

        size : float
            Diameter of the angle annotation in units specified by *unit*.

        unit : str
            One of the following strings to specify the unit of *size*:

            * "pixels": pixels
            * "points": points, use points instead of pixels to not have a
              dependence on the DPI
            * "axes width", "axes height": relative units of Axes width, height
            * "axes min", "axes max": minimum or maximum of relative Axes
              width, height

        ax : `matplotlib.axes.Axes`
            The Axes to add the angle annotation to.

        text : str
            The text to mark the angle with.

        textposition : {"inside", "outside", "edge"}
            Whether to show the text in- or outside the arc. "edge" can be used
            for custom positions anchored at the arc's edge.

        text_kw : dict
            Dictionary of arguments passed to the Annotation.

        **kwargs
            Further parameters are passed to `matplotlib.patches.Arc`. Use this
            to specify, color, linewidth etc. of the arc.

        """
        self.ax = ax or plt.gca()
        self._xydata = xy  # in data coordinates
        self.vec1 = p1
        self.vec2 = p2
        self.size = size
        self.unit = unit
        self.textposition = textposition

        super().__init__(self._xydata, size, size, angle=0.0,
                         theta1=self.theta1, theta2=self.theta2, **kwargs)

        self.set_transform(IdentityTransform())
        self.ax.add_patch(self)

        self.kw = dict(ha="center", va="center",
                       xycoords=IdentityTransform(),
                       xytext=(0, 0), textcoords="offset points",
                       annotation_clip=True)
        self.kw.update(text_kw or {})
        self.text = ax.annotate(text, xy=self._center, **self.kw)

    def get_size(self):
        factor = 1.
        if self.unit == "points":
            factor = self.ax.figure.dpi / 72.
        elif self.unit[:4] == "axes":
            b = TransformedBbox(Bbox.unit(), self.ax.transAxes)
            dic = {"max": max(b.width, b.height),
                   "min": min(b.width, b.height),
                   "width": b.width, "height": b.height}
            factor = dic[self.unit[5:]]
        return self.size * factor

    def set_size(self, size):
        self.size = size

    def get_center_in_pixels(self):
        """return center in pixels"""
        return self.ax.transData.transform(self._xydata)

    def set_center(self, xy):
        """set center in data coordinates"""
        self._xydata = xy

    def get_theta(self, vec):
        vec_in_pixels = self.ax.transData.transform(vec) - self._center
        return np.rad2deg(np.arctan2(vec_in_pixels[1], vec_in_pixels[0]))

    def get_theta1(self):
        return self.get_theta(self.vec1)

    def get_theta2(self):
        return self.get_theta(self.vec2)

    def set_theta(self, angle):
        pass

    # Redefine attributes of the Arc to always give values in pixel space
    _center = property(get_center_in_pixels, set_center)
    theta1 = property(get_theta1, set_theta)
    theta2 = property(get_theta2, set_theta)
    width = property(get_size, set_size)
    height = property(get_size, set_size)

    # The following two methods are needed to update the text position.
    def draw(self, renderer):
        self.update_text()
        super().draw(renderer)

    def update_text(self):
        c = self._center
        s = self.get_size()
        angle_span = (self.theta2 - self.theta1) % 360
        angle = np.deg2rad(self.theta1 + angle_span / 2)
        r = s / 2
        if self.textposition == "inside":
            r = s / np.interp(angle_span, [60, 90, 135, 180],
                                          [3.3, 3.5, 3.8, 4])
        self.text.xy = c + r * np.array([np.cos(angle), np.sin(angle)])
        if self.textposition == "outside":
            def R90(a, r, w, h):
                if a < np.arctan(h/2/(r+w/2)):
                    return np.sqrt((r+w/2)**2 + (np.tan(a)*(r+w/2))**2)
                else:
                    c = np.sqrt((w/2)**2+(h/2)**2)
                    T = np.arcsin(c * np.cos(np.pi/2 - a + np.arcsin(h/2/c))/r)
                    xy = r * np.array([np.cos(a + T), np.sin(a + T)])
                    xy += np.array([w/2, h/2])
                    return np.sqrt(np.sum(xy**2))

            def R(a, r, w, h):
                aa = (a % (np.pi/4))*((a % (np.pi/2)) <= np.pi/4) + \
                     (np.pi/4 - (a % (np.pi/4)))*((a % (np.pi/2)) >= np.pi/4)
                return R90(aa, r, *[w, h][::int(np.sign(np.cos(2*a)))])

            bbox = self.text.get_window_extent()
            X = R(angle, r, bbox.width, bbox.height)
            trans = self.ax.figure.dpi_scale_trans.inverted()
            offs = trans.transform(((X-s/2), 0))[0] * 72
            self.text.set_position([offs*np.cos(angle), offs*np.sin(angle)])
使用法#
に必要な引数AngleAnnotationは、円弧の中心xyと 2 つの点です。これにより、円弧は、 p1とp2をそれぞれxyで接続する 2 つのベクトル間にまたがり
ます。それらはデータ座標で与えられます。追加の引数は、円弧のサイズとその単位です。さらに、
textpositionの値に応じて、円弧の内側または外側に描画されるテキストを指定できます。これらの引数の使用法を以下に示します。
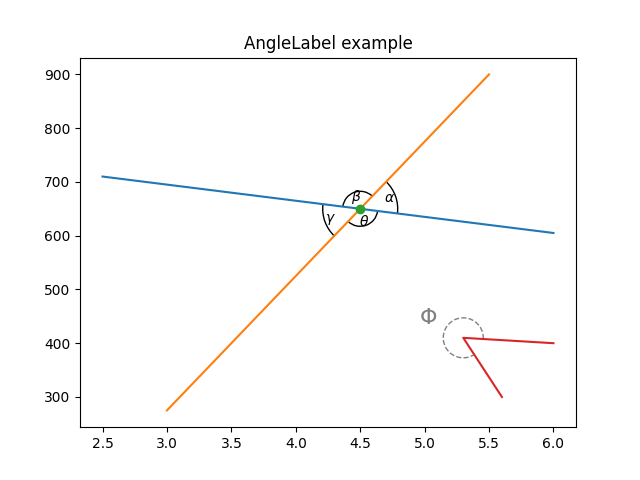
fig, ax = plt.subplots()
fig.canvas.draw()  # Need to draw the figure to define renderer
ax.set_title("AngleLabel example")

# Plot two crossing lines and label each angle between them with the above
# ``AngleAnnotation`` tool.
center = (4.5, 650)
p1 = [(2.5, 710), (6.0, 605)]
p2 = [(3.0, 275), (5.5, 900)]
line1, = ax.plot(*zip(*p1))
line2, = ax.plot(*zip(*p2))
point, = ax.plot(*center, marker="o")

am1 = AngleAnnotation(center, p1[1], p2[1], ax=ax, size=75, text=r"$\alpha$")
am2 = AngleAnnotation(center, p2[1], p1[0], ax=ax, size=35, text=r"$\beta$")
am3 = AngleAnnotation(center, p1[0], p2[0], ax=ax, size=75, text=r"$\gamma$")
am4 = AngleAnnotation(center, p2[0], p1[1], ax=ax, size=35, text=r"$\theta$")


# Showcase some styling options for the angle arc, as well as the text.
p = [(6.0, 400), (5.3, 410), (5.6, 300)]
ax.plot(*zip(*p))
am5 = AngleAnnotation(p[1], p[0], p[2], ax=ax, size=40, text=r"$\Phi$",
                      linestyle="--", color="gray", textposition="outside",
                      text_kw=dict(fontsize=16, color="gray"))
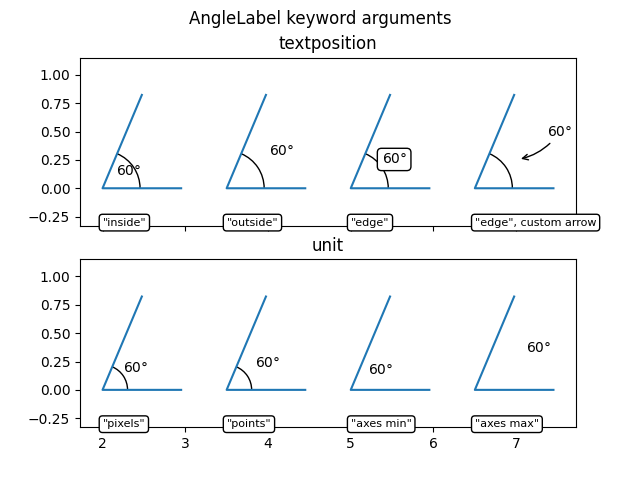
AngleLabelオプション#
次に示すように、 textpositionおよびunitキーワード引数を使用して、テキスト ラベルの位置を変更できます。
# Helper function to draw angle easily.
def plot_angle(ax, pos, angle, length=0.95, acol="C0", **kwargs):
    vec2 = np.array([np.cos(np.deg2rad(angle)), np.sin(np.deg2rad(angle))])
    xy = np.c_[[length, 0], [0, 0], vec2*length].T + np.array(pos)
    ax.plot(*xy.T, color=acol)
    return AngleAnnotation(pos, xy[0], xy[2], ax=ax, **kwargs)


fig, (ax1, ax2) = plt.subplots(nrows=2, sharex=True)
fig.suptitle("AngleLabel keyword arguments")
fig.canvas.draw()  # Need to draw the figure to define renderer

# Showcase different text positions.
ax1.margins(y=0.4)
ax1.set_title("textposition")
kw = dict(size=75, unit="points", text=r"$60°$")

am6 = plot_angle(ax1, (2.0, 0), 60, textposition="inside", **kw)
am7 = plot_angle(ax1, (3.5, 0), 60, textposition="outside", **kw)
am8 = plot_angle(ax1, (5.0, 0), 60, textposition="edge",
                 text_kw=dict(bbox=dict(boxstyle="round", fc="w")), **kw)
am9 = plot_angle(ax1, (6.5, 0), 60, textposition="edge",
                 text_kw=dict(xytext=(30, 20), arrowprops=dict(arrowstyle="->",
                              connectionstyle="arc3,rad=-0.2")), **kw)

for x, text in zip([2.0, 3.5, 5.0, 6.5], ['"inside"', '"outside"', '"edge"',
                                          '"edge", custom arrow']):
    ax1.annotate(text, xy=(x, 0), xycoords=ax1.get_xaxis_transform(),
                 bbox=dict(boxstyle="round", fc="w"), ha="left", fontsize=8,
                 annotation_clip=True)

# Showcase different size units. The effect of this can best be observed
# by interactively changing the figure size
ax2.margins(y=0.4)
ax2.set_title("unit")
kw = dict(text=r"$60°$", textposition="outside")

am10 = plot_angle(ax2, (2.0, 0), 60, size=50, unit="pixels", **kw)
am11 = plot_angle(ax2, (3.5, 0), 60, size=50, unit="points", **kw)
am12 = plot_angle(ax2, (5.0, 0), 60, size=0.25, unit="axes min", **kw)
am13 = plot_angle(ax2, (6.5, 0), 60, size=0.25, unit="axes max", **kw)

for x, text in zip([2.0, 3.5, 5.0, 6.5], ['"pixels"', '"points"',
                                          '"axes min"', '"axes max"']):
    ax2.annotate(text, xy=(x, 0), xycoords=ax2.get_xaxis_transform(),
                 bbox=dict(boxstyle="round", fc="w"), ha="left", fontsize=8,
                 annotation_clip=True)

plt.show()
参考文献
この例では、次の関数、メソッド、クラス、およびモジュールの使用が示されています。
スクリプトの合計実行時間: ( 0 分 1.034 秒)