ノート
完全なサンプルコードをダウンロードするには、ここをクリックしてください
名前付きの色のリスト#
これは、matplotlib でサポートされている名前付きの色のリストをプロットします。matplotlib の色の詳細については、次を参照してください。
色の指定のチュートリアル。
API
matplotlib.colors;カラーデモ。
プロットのためのヘルパー関数#
まず、色のテーブルを作成するためのヘルパー関数を定義し、それをいくつかの一般的な色カテゴリで使用します。
from matplotlib.patches import Rectangle
import matplotlib.pyplot as plt
import matplotlib.colors as mcolors


def plot_colortable(colors, sort_colors=True, emptycols=0):

    cell_width = 212
    cell_height = 22
    swatch_width = 48
    margin = 12

    # Sort colors by hue, saturation, value and name.
    if sort_colors is True:
        by_hsv = sorted((tuple(mcolors.rgb_to_hsv(mcolors.to_rgb(color))),
                         name)
                        for name, color in colors.items())
        names = [name for hsv, name in by_hsv]
    else:
        names = list(colors)

    n = len(names)
    ncols = 4 - emptycols
    nrows = n // ncols + int(n % ncols > 0)

    width = cell_width * 4 + 2 * margin
    height = cell_height * nrows + 2 * margin
    dpi = 72

    fig, ax = plt.subplots(figsize=(width / dpi, height / dpi), dpi=dpi)
    fig.subplots_adjust(margin/width, margin/height,
                        (width-margin)/width, (height-margin)/height)
    ax.set_xlim(0, cell_width * 4)
    ax.set_ylim(cell_height * (nrows-0.5), -cell_height/2.)
    ax.yaxis.set_visible(False)
    ax.xaxis.set_visible(False)
    ax.set_axis_off()

    for i, name in enumerate(names):
        row = i % nrows
        col = i // nrows
        y = row * cell_height

        swatch_start_x = cell_width * col
        text_pos_x = cell_width * col + swatch_width + 7

        ax.text(text_pos_x, y, name, fontsize=14,
                horizontalalignment='left',
                verticalalignment='center')

        ax.add_patch(
            Rectangle(xy=(swatch_start_x, y-9), width=swatch_width,
                      height=18, facecolor=colors[name], edgecolor='0.7')
        )

    return fig
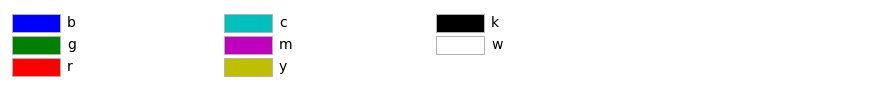
ベースカラー#
plot_colortable(mcolors.BASE_COLORS, sort_colors=False, emptycols=1)
<Figure size 872x90 with 1 Axes>
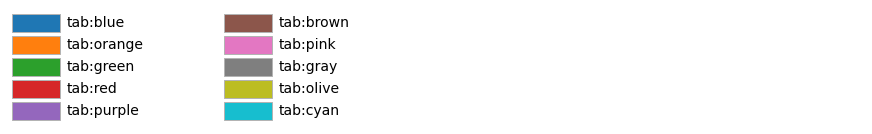
Tableau パレット#
plot_colortable(mcolors.TABLEAU_COLORS, sort_colors=False, emptycols=2)
<Figure size 872x134 with 1 Axes>
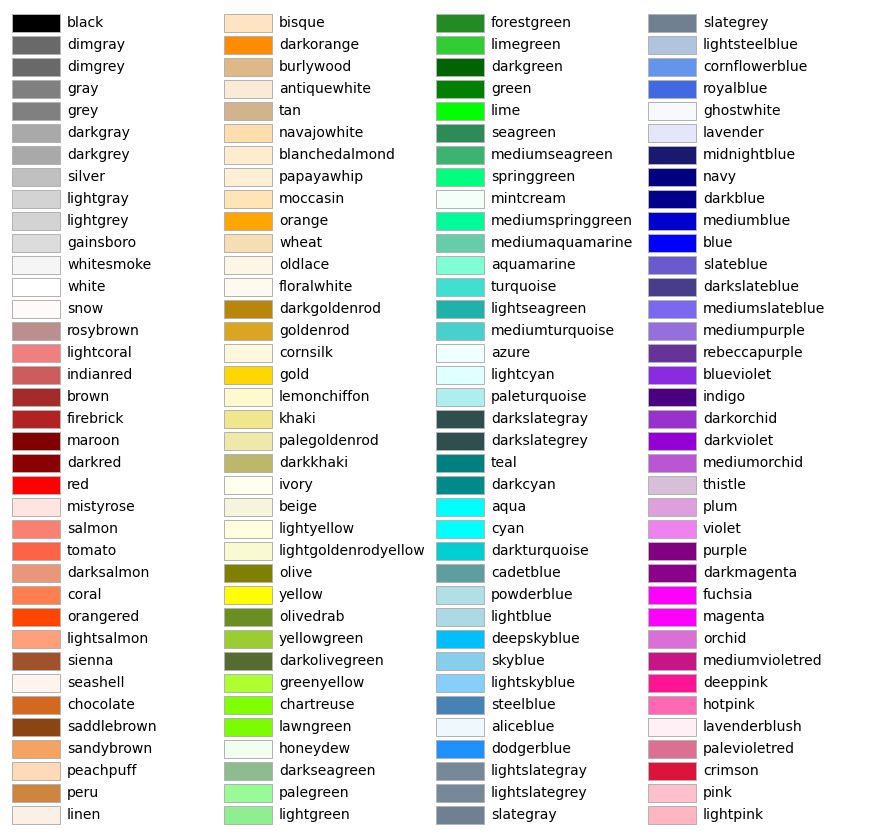
CSS の色#
plot_colortable(mcolors.CSS4_COLORS)
plt.show()
XKCD カラー#
XKCD カラーはサポートされていますが、大きな図が生成されるため、ここではスキップします。必要に応じて、次のコードを使用できます。
xkcd_fig = plot_colortable(mcolors.XKCD_COLORS, "XKCD Colors")
xkcd_fig.savefig("XKCD_Colors.png")
参考文献
この例では、次の関数、メソッド、クラス、およびモジュールの使用が示されています。
スクリプトの合計実行時間: ( 0 分 1.530 秒)