ノート
完全なサンプルコードをダウンロードするには、ここをクリックしてください
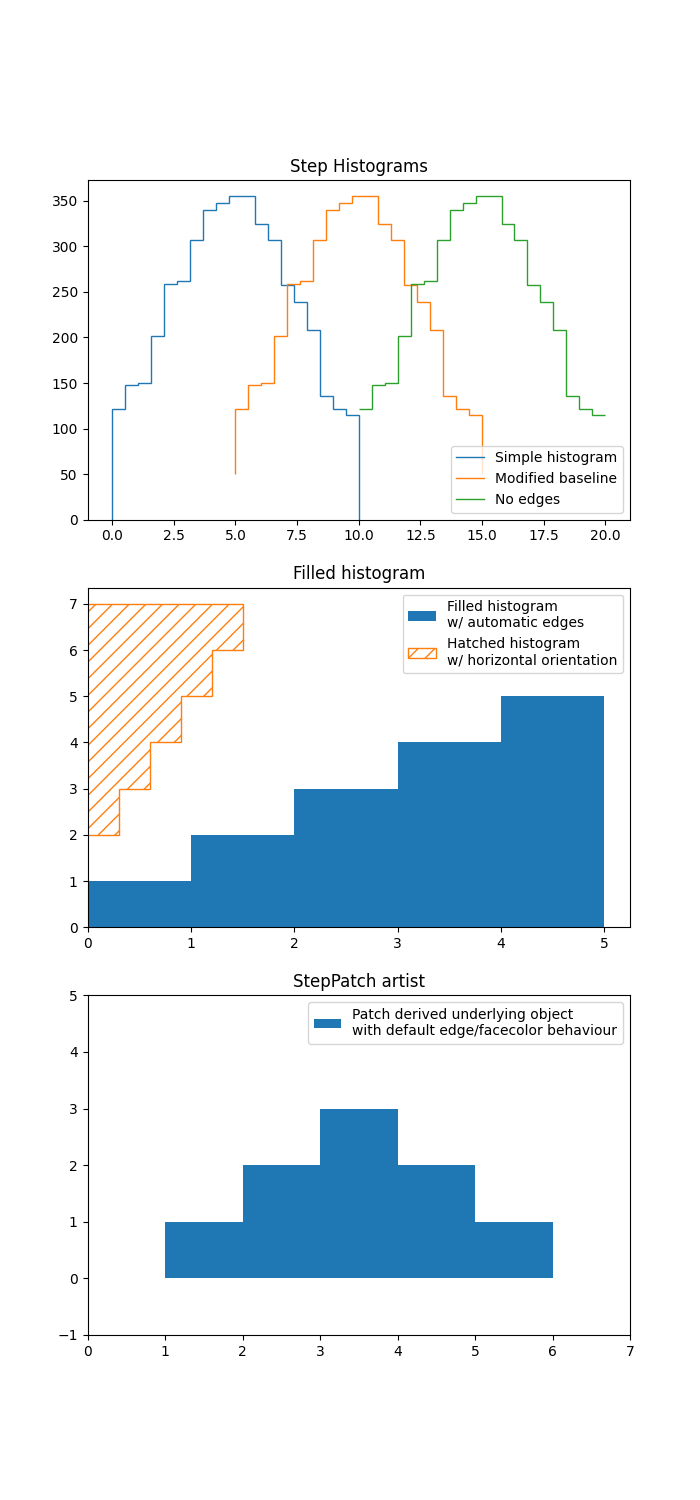
階段のデモ#
この例では、stairsfor ステップワイズ定数関数の使用を示します。一般的な使用例は、ヒストグラムおよびヒストグラムのようなデータの視覚化です。
import numpy as np
import matplotlib.pyplot as plt
from matplotlib.patches import StepPatch

np.random.seed(0)
h, edges = np.histogram(np.random.normal(5, 3, 5000),
                        bins=np.linspace(0, 10, 20))

fig, axs = plt.subplots(3, 1, figsize=(7, 15))
axs[0].stairs(h, edges, label='Simple histogram')
axs[0].stairs(h, edges + 5, baseline=50, label='Modified baseline')
axs[0].stairs(h, edges + 10, baseline=None, label='No edges')
axs[0].set_title("Step Histograms")

axs[1].stairs(np.arange(1, 6, 1), fill=True,
              label='Filled histogram\nw/ automatic edges')
axs[1].stairs(np.arange(1, 6, 1)*0.3, np.arange(2, 8, 1),
              orientation='horizontal', hatch='//',
              label='Hatched histogram\nw/ horizontal orientation')
axs[1].set_title("Filled histogram")

patch = StepPatch(values=[1, 2, 3, 2, 1],
                  edges=range(1, 7),
                  label=('Patch derived underlying object\n'
                         'with default edge/facecolor behaviour'))
axs[2].add_patch(patch)
axs[2].set_xlim(0, 7)
axs[2].set_ylim(-1, 5)
axs[2].set_title("StepPatch artist")

for ax in axs:
    ax.legend()
plt.show()
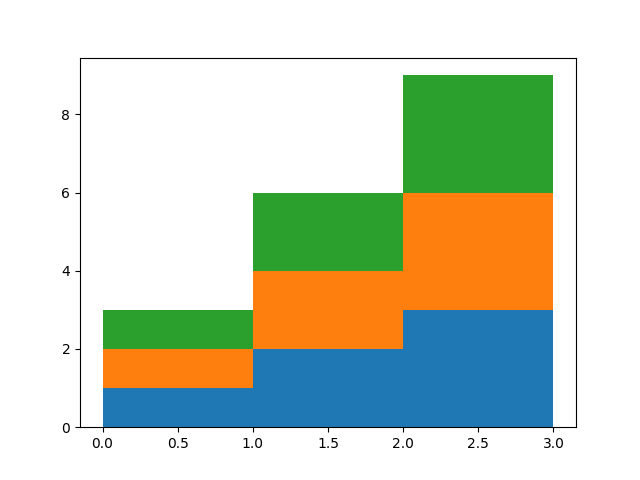
ベースラインは、積み重ねられたヒストグラム プロットを可能にする配列を取ることができます
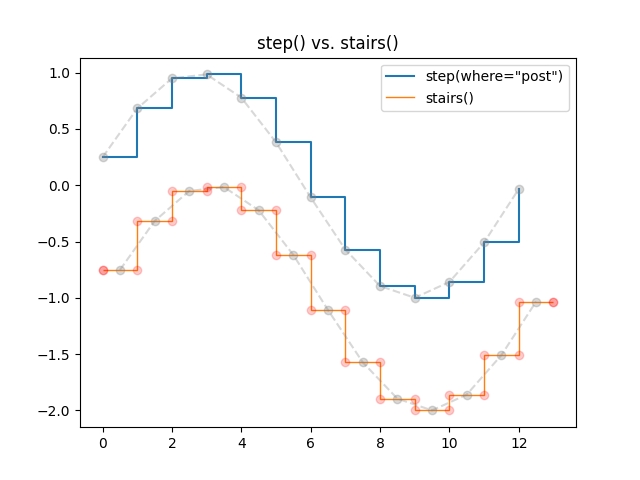
pyplot.stepと#の比較pyplot.stairs
pyplot.stepステップの位置を単一の値として定義します。ステップは、パラメーターwhere に応じて、これらの参照値から左/右/両方向に拡張されます。xとyの値の数は同じです。
対照的に、は、ステップの値よりも 1 要素長い、境界のedgepyplot.stairsを介してステップの位置を定義します。
bins = np.arange(14)
centers = bins[:-1] + np.diff(bins) / 2
y = np.sin(centers / 2)

plt.step(bins[:-1], y, where='post', label='step(where="post")')
plt.plot(bins[:-1], y, 'o--', color='grey', alpha=0.3)

plt.stairs(y - 1, bins, baseline=None, label='stairs()')
plt.plot(centers, y - 1, 'o--', color='grey', alpha=0.3)
plt.plot(np.repeat(bins, 2), np.hstack([y[0], np.repeat(y, 2), y[-1]]) - 1,
         'o', color='red', alpha=0.2)

plt.legend()
plt.title('step() vs. stairs()')
plt.show()
参考文献
この例では、次の関数、メソッド、クラス、およびモジュールの使用が示されています。
スクリプトの合計実行時間: ( 0 分 1.666 秒)