ノート
完全なサンプルコードをダウンロードするには、ここをクリックしてください
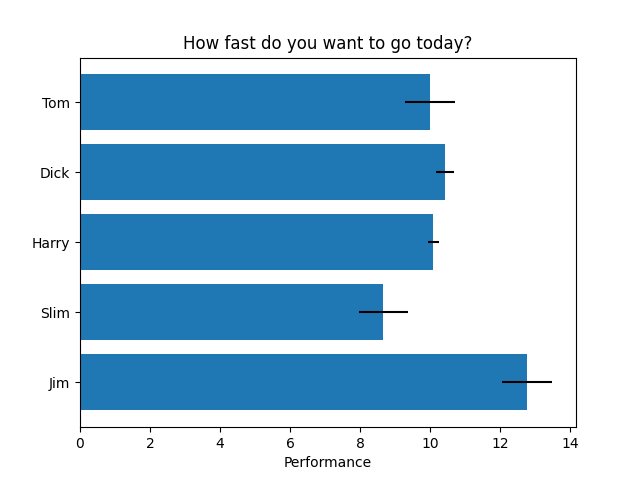
横棒グラフ#
この例は、単純な横棒グラフを示しています。
import matplotlib.pyplot as plt
import numpy as np

# Fixing random state for reproducibility
np.random.seed(19680801)


plt.rcdefaults()
fig, ax = plt.subplots()

# Example data
people = ('Tom', 'Dick', 'Harry', 'Slim', 'Jim')
y_pos = np.arange(len(people))
performance = 3 + 10 * np.random.rand(len(people))
error = np.random.rand(len(people))

ax.barh(y_pos, performance, xerr=error, align='center')
ax.set_yticks(y_pos, labels=people)
ax.invert_yaxis()  # labels read top-to-bottom
ax.set_xlabel('Performance')
ax.set_title('How fast do you want to go today?')

plt.show()