ノート
完全なサンプルコードをダウンロードするには、ここをクリックしてください
TickedStroke パスエフェクト#
Matplotlibpatheffectsを使用して、ほとんどすべてに影響を与えることができる十分に低いレベルでパスを描画する方法を変更できます。
パスエフェクト ガイドでは、 パスエフェクトの使用について詳しく説明しています。
ここTickedStrokeに示されているパスエフェクトは、チェックされたスタイルでパスを描画します。目盛りの間隔、長さ、および角度を制御できます。
輪郭デモの例も参照してください。
最適化の例 の輪郭も参照してください。
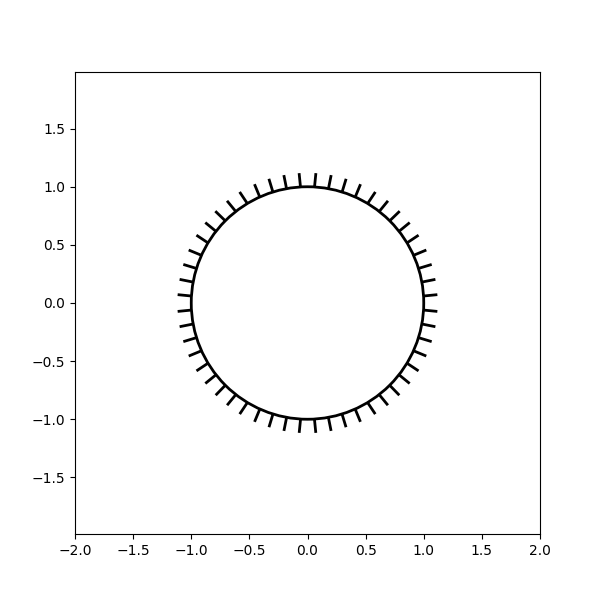
パスへの TickedStroke の適用#
import matplotlib.patches as patches
from matplotlib.path import Path
import numpy as np
import matplotlib.pyplot as plt
import matplotlib.patheffects as patheffects

fig, ax = plt.subplots(figsize=(6, 6))
path = Path.unit_circle()
patch = patches.PathPatch(path, facecolor='none', lw=2, path_effects=[
    patheffects.withTickedStroke(angle=-90, spacing=10, length=1)])

ax.add_patch(patch)
ax.axis('equal')
ax.set_xlim(-2, 2)
ax.set_ylim(-2, 2)

plt.show()
ラインへの TickedStroke の適用#
fig, ax = plt.subplots(figsize=(6, 6))
ax.plot([0, 1], [0, 1], label="Line",
        path_effects=[patheffects.withTickedStroke(spacing=7, angle=135)])

nx = 101
x = np.linspace(0.0, 1.0, nx)
y = 0.3*np.sin(x*8) + 0.4
ax.plot(x, y, label="Curve", path_effects=[patheffects.withTickedStroke()])

ax.legend()

plt.show()

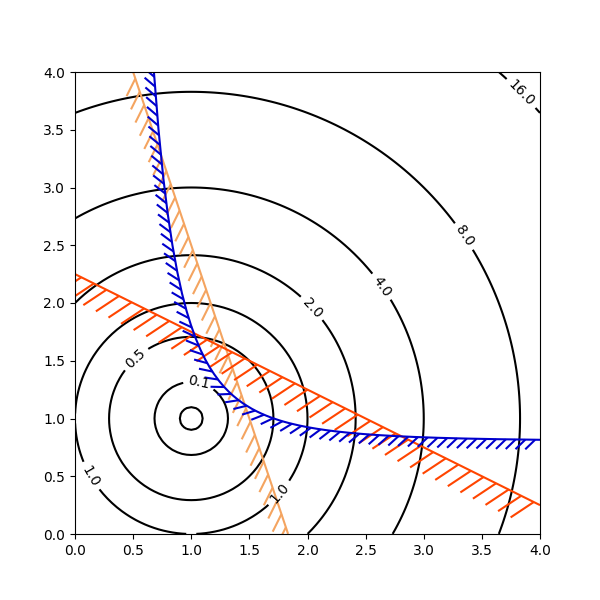
等高線図に TickedStroke を適用する#
目的と制約を含む等高線図。最適化問題の典型的な制約を表すために等高線によって生成される曲線は、0 ~ 180 度の角度でプロットする必要があります。
fig, ax = plt.subplots(figsize=(6, 6))

nx = 101
ny = 105

# Set up survey vectors
xvec = np.linspace(0.001, 4.0, nx)
yvec = np.linspace(0.001, 4.0, ny)

# Set up survey matrices.  Design disk loading and gear ratio.
x1, x2 = np.meshgrid(xvec, yvec)

# Evaluate some stuff to plot
obj = x1**2 + x2**2 - 2*x1 - 2*x2 + 2
g1 = -(3*x1 + x2 - 5.5)
g2 = -(x1 + 2*x2 - 4.5)
g3 = 0.8 + x1**-3 - x2

cntr = ax.contour(x1, x2, obj, [0.01, 0.1, 0.5, 1, 2, 4, 8, 16],
                  colors='black')
ax.clabel(cntr, fmt="%2.1f", use_clabeltext=True)

cg1 = ax.contour(x1, x2, g1, [0], colors='sandybrown')
plt.setp(cg1.collections,
         path_effects=[patheffects.withTickedStroke(angle=135)])

cg2 = ax.contour(x1, x2, g2, [0], colors='orangered')
plt.setp(cg2.collections,
         path_effects=[patheffects.withTickedStroke(angle=60, length=2)])

cg3 = ax.contour(x1, x2, g3, [0], colors='mediumblue')
plt.setp(cg3.collections,
         path_effects=[patheffects.withTickedStroke(spacing=7)])

ax.set_xlim(0, 4)
ax.set_ylim(0, 4)

plt.show()
スクリプトの合計実行時間: ( 0 分 1.492 秒)