ノート
完全なサンプルコードをダウンロードするには、ここをクリックしてください
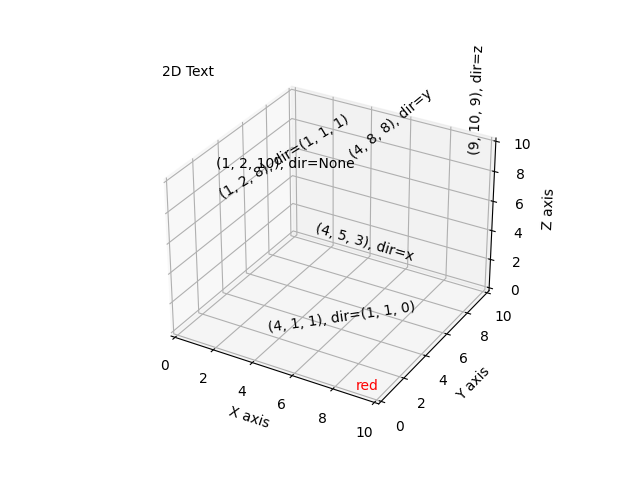
3D でのテキスト注釈#
3D プロットでのテキスト注釈の配置を示します。
表示される機能:
3 種類の 'zdir' 値で text 関数を使用: なし、軸名 (例: 'x')、または方向のタプル (例: (1, 1, 0))。
color キーワードで text 関数を使用します。
text2D 関数を使用して、テキストを ax オブジェクトの固定位置に配置します。
import matplotlib.pyplot as plt


ax = plt.figure().add_subplot(projection='3d')

# Demo 1: zdir
zdirs = (None, 'x', 'y', 'z', (1, 1, 0), (1, 1, 1))
xs = (1, 4, 4, 9, 4, 1)
ys = (2, 5, 8, 10, 1, 2)
zs = (10, 3, 8, 9, 1, 8)

for zdir, x, y, z in zip(zdirs, xs, ys, zs):
    label = '(%d, %d, %d), dir=%s' % (x, y, z, zdir)
    ax.text(x, y, z, label, zdir)

# Demo 2: color
ax.text(9, 0, 0, "red", color='red')

# Demo 3: text2D
# Placement 0, 0 would be the bottom left, 1, 1 would be the top right.
ax.text2D(0.05, 0.95, "2D Text", transform=ax.transAxes)

# Tweaking display region and labels
ax.set_xlim(0, 10)
ax.set_ylim(0, 10)
ax.set_zlim(0, 10)
ax.set_xlabel('X axis')
ax.set_ylabel('Y axis')
ax.set_zlabel('Z axis')

plt.show()