ノート
完全なサンプルコードをダウンロードするには、ここをクリックしてください
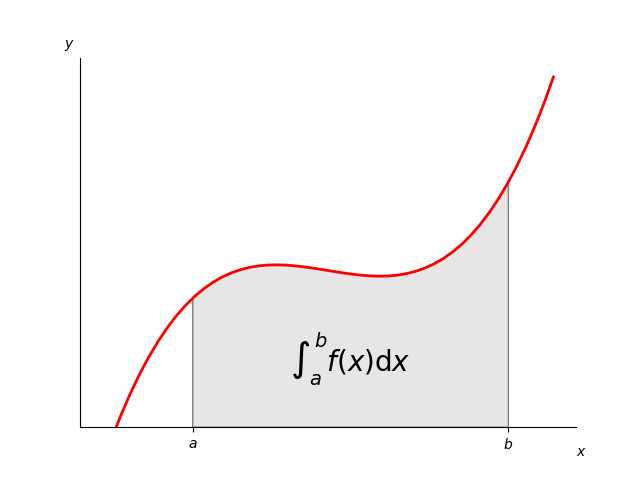
曲線の下の面積としての積分#
これは単純な例ですが、いくつかの重要な調整を示しています。
カスタムの色と線幅を使用した単純な折れ線グラフ。
ポリゴン パッチを使用して作成された陰影のある領域。
数学テキスト レンダリングを使用したテキスト ラベル。
figtext を呼び出して、x 軸と y 軸にラベルを付けます。
軸スパインを使用して、上部と右のスパインを非表示にします。
カスタムの目盛りの配置とラベル。
import numpy as np
import matplotlib.pyplot as plt
from matplotlib.patches import Polygon


def func(x):
    return (x - 3) * (x - 5) * (x - 7) + 85


a, b = 2, 9  # integral limits
x = np.linspace(0, 10)
y = func(x)

fig, ax = plt.subplots()
ax.plot(x, y, 'r', linewidth=2)
ax.set_ylim(bottom=0)

# Make the shaded region
ix = np.linspace(a, b)
iy = func(ix)
verts = [(a, 0), *zip(ix, iy), (b, 0)]
poly = Polygon(verts, facecolor='0.9', edgecolor='0.5')
ax.add_patch(poly)

ax.text(0.5 * (a + b), 30, r"$\int_a^b f(x)\mathrm{d}x$",
        horizontalalignment='center', fontsize=20)

fig.text(0.9, 0.05, '$x$')
fig.text(0.1, 0.9, '$y$')

ax.spines.right.set_visible(False)
ax.spines.top.set_visible(False)
ax.xaxis.set_ticks_position('bottom')

ax.set_xticks([a, b], labels=['$a$', '$b$'])
ax.set_yticks([])

plt.show()