ノート
完全なサンプルコードをダウンロードするには、ここをクリックしてください
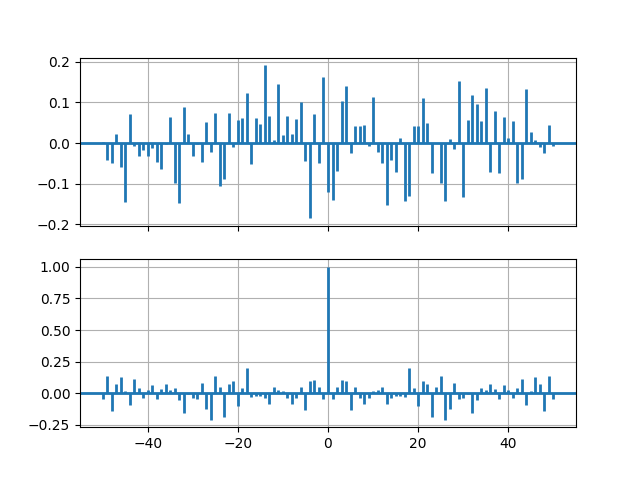
相互相関と自己相関のデモ#
相互相関 ( xcorr) および自己相関 ( acorr) プロットの使用例。
import matplotlib.pyplot as plt
import numpy as np


# Fixing random state for reproducibility
np.random.seed(19680801)


x, y = np.random.randn(2, 100)
fig, [ax1, ax2] = plt.subplots(2, 1, sharex=True)
ax1.xcorr(x, y, usevlines=True, maxlags=50, normed=True, lw=2)
ax1.grid(True)

ax2.acorr(x, usevlines=True, normed=True, maxlags=50, lw=2)
ax2.grid(True)

plt.show()
参考文献
この例では、次の関数、メソッド、クラス、およびモジュールの使用が示されています。