ノート
完全なサンプルコードをダウンロードするには、ここをクリックしてください
複数のサブプロット#
複数のサブプロットを含む単純なデモ。
その他のオプションについては、plt.subplots を使用した複数のサブプロットの作成を参照してください。
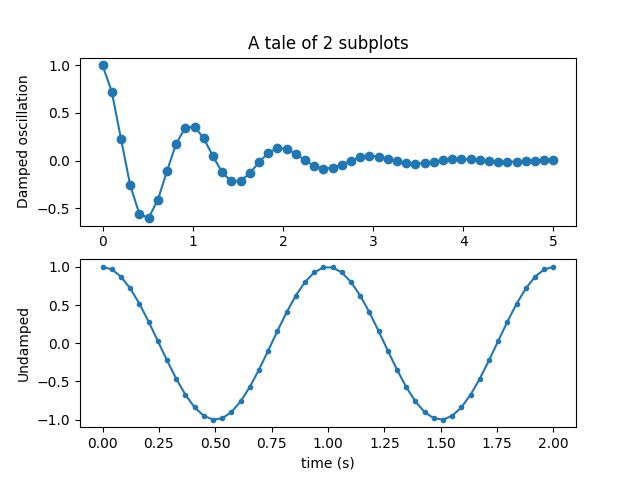
subplots()は、単純なサブプロットの配置を生成するための推奨される方法です。
fig, (ax1, ax2) = plt.subplots(2, 1)
fig.suptitle('A tale of 2 subplots')

ax1.plot(x1, y1, 'o-')
ax1.set_ylabel('Damped oscillation')

ax2.plot(x2, y2, '.-')
ax2.set_xlabel('time (s)')
ax2.set_ylabel('Undamped')

plt.show()
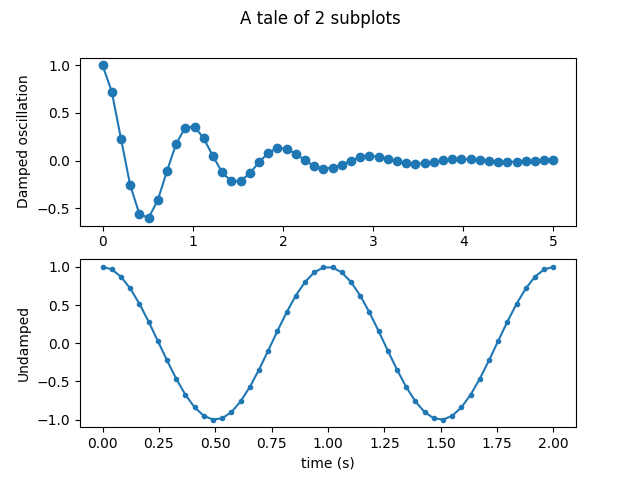
サブプロットは、次を使用して一度に 1 つずつ生成することもできますsubplot()。
plt.subplot(2, 1, 1)
plt.plot(x1, y1, 'o-')
plt.title('A tale of 2 subplots')
plt.ylabel('Damped oscillation')

plt.subplot(2, 1, 2)
plt.plot(x2, y2, '.-')
plt.xlabel('time (s)')
plt.ylabel('Undamped')

plt.show()