ノート
完全なサンプルコードをダウンロードするには、ここをクリックしてください
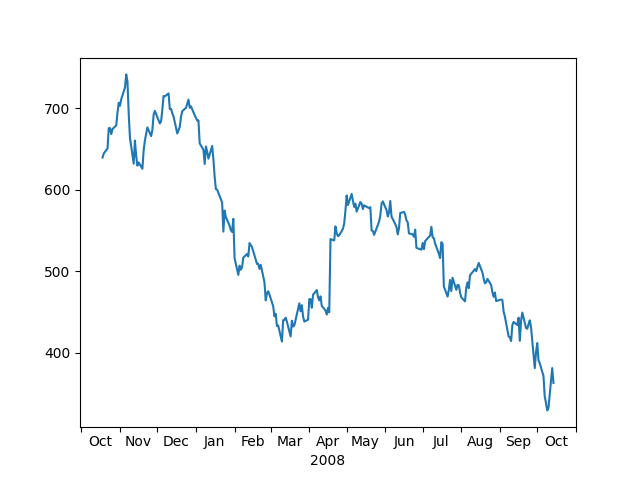
目盛り間のラベルの中央揃え#
目盛りラベルは、関連付けられた目盛りに対して相対的に配置されます。'center'、'left'、または 'right' の配置は、水平方向の配置プロパティを使用して制御できます。
for label in ax.get_xticklabels():
    label.set_horizontalalignment('right')
ただし、目盛り間のラベルを中央に配置する直接的な方法はありません。この振る舞いを偽造するために、大目盛りの間の小目盛りにラベルを付けて、大目盛りラベルと小目盛りを非表示にすることができます。
これは、目盛りの間の中央にある月にラベルを付ける例です。
import numpy as np
import matplotlib.cbook as cbook
import matplotlib.dates as dates
import matplotlib.ticker as ticker
import matplotlib.pyplot as plt

# Load some financial data; Google's stock price
r = (cbook.get_sample_data('goog.npz', np_load=True)['price_data']
     .view(np.recarray))
r = r[-250:]  # get the last 250 days

fig, ax = plt.subplots()
ax.plot(r.date, r.adj_close)

ax.xaxis.set_major_locator(dates.MonthLocator())
# 16 is a slight approximation since months differ in number of days.
ax.xaxis.set_minor_locator(dates.MonthLocator(bymonthday=16))

ax.xaxis.set_major_formatter(ticker.NullFormatter())
ax.xaxis.set_minor_formatter(dates.DateFormatter('%b'))

# Remove the tick lines
ax.tick_params(axis='x', which='minor', tick1On=False, tick2On=False)

# Align the minor tick label
for label in ax.get_xticklabels(minor=True):
    label.set_horizontalalignment('center')
imid = len(r) // 2
ax.set_xlabel(str(r.date[imid].item().year))
plt.show()