ノート
完全なサンプルコードをダウンロードするには、ここをクリックしてください
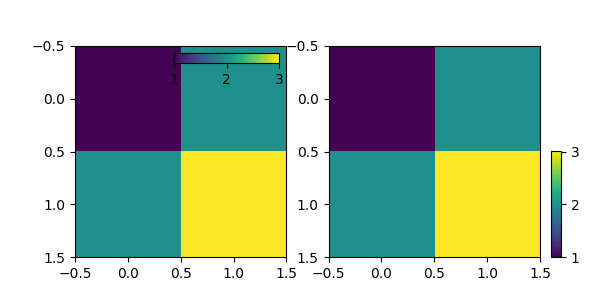
Inset Axes でカラーバーの位置とサイズを制御する#
この例では、 を使用してカラー バーの位置、高さ、および幅を制御する方法を示しますinset_axes。
挿入軸の配置は凡例と同様に制御されます: loc オプション (「右上」、「最適」など) を提供するか、親 bbox に関するロケーターを提供します。bbox_to_anchorやborderpadなどのパラメータも同様に機能し、ここでも示されています。
import matplotlib.pyplot as plt
from mpl_toolkits.axes_grid1.inset_locator import inset_axes

fig, (ax1, ax2) = plt.subplots(1, 2, figsize=[6, 3])

im1 = ax1.imshow([[1, 2], [2, 3]])
axins1 = inset_axes(
    ax1,
    width="50%",  # width: 50% of parent_bbox width
    height="5%",  # height: 5%
    loc="upper right",
)
axins1.xaxis.set_ticks_position("bottom")
fig.colorbar(im1, cax=axins1, orientation="horizontal", ticks=[1, 2, 3])

im = ax2.imshow([[1, 2], [2, 3]])
axins = inset_axes(
    ax2,
    width="5%",  # width: 5% of parent_bbox width
    height="50%",  # height: 50%
    loc="lower left",
    bbox_to_anchor=(1.05, 0., 1, 1),
    bbox_transform=ax2.transAxes,
    borderpad=0,
)
fig.colorbar(im, cax=axins, ticks=[1, 2, 3])

plt.show()