ノート
完全なサンプルコードをダウンロードするには、ここをクリックしてください
制限されたレイアウトで軸のサイズを変更する#
制約付きレイアウトは、Axes オブジェクトと Axes 上のラベルが重ならないように、Figure 内のサブプロットのサイズを変更しようとします。
詳細については制約付きレイアウト ガイドを、別の方法についてはタイト レイアウト ガイドを参照してください 。
import matplotlib.pyplot as plt


def example_plot(ax):
    ax.plot([1, 2])
    ax.set_xlabel('x-label', fontsize=12)
    ax.set_ylabel('y-label', fontsize=12)
    ax.set_title('Title', fontsize=14)
Constrained_layout を使用しない場合、ラベルが軸に重なる
fig, axs = plt.subplots(nrows=2, ncols=2, constrained_layout=False)

for ax in axs.flat:
    example_plot(ax)
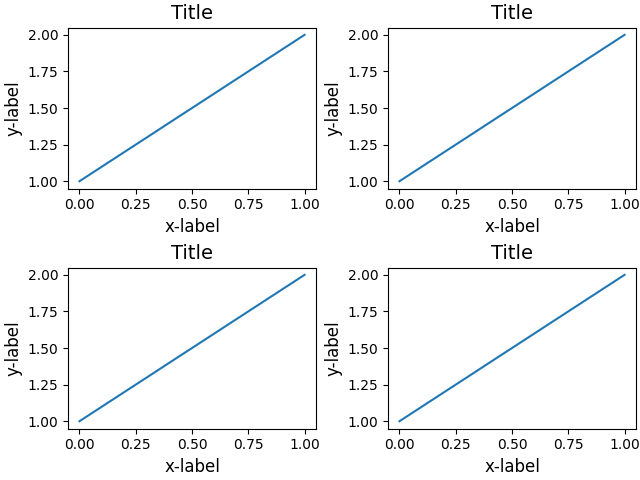
追加するとconstrained_layout=True自動的に調整されます。
fig, axs = plt.subplots(nrows=2, ncols=2, constrained_layout=True)

for ax in axs.flat:
    example_plot(ax)

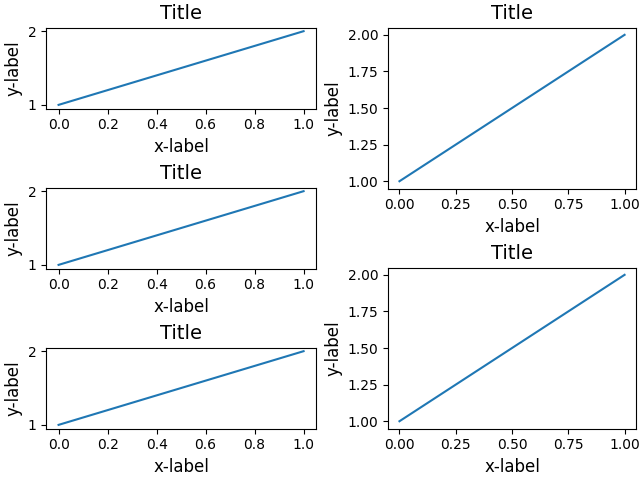
以下は、ネストされた gridspec を使用した、より複雑な例です。
fig = plt.figure(constrained_layout=True)

import matplotlib.gridspec as gridspec

gs0 = gridspec.GridSpec(1, 2, figure=fig)

gs1 = gridspec.GridSpecFromSubplotSpec(3, 1, subplot_spec=gs0[0])
for n in range(3):
    ax = fig.add_subplot(gs1[n])
    example_plot(ax)


gs2 = gridspec.GridSpecFromSubplotSpec(2, 1, subplot_spec=gs0[1])
for n in range(2):
    ax = fig.add_subplot(gs2[n])
    example_plot(ax)

plt.show()
参考文献
この例では、次の関数、メソッド、クラス、およびモジュールの使用が示されています。
スクリプトの合計実行時間: ( 0 分 2.712 秒)