ノート
完全なサンプルコードをダウンロードするには、ここをクリックしてください
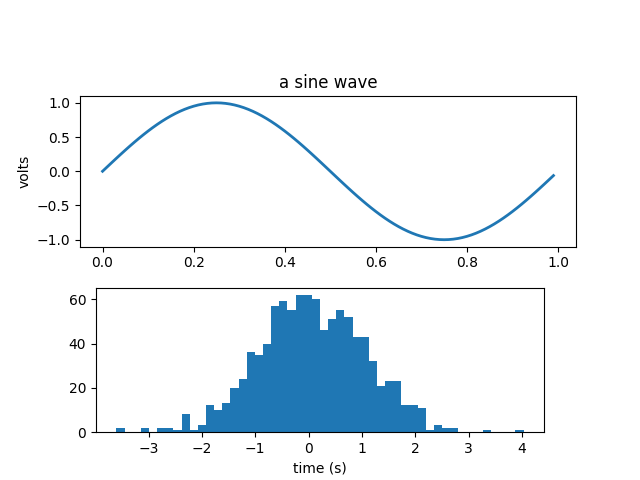
単純な軸ラベル#
プロットの軸にラベルを付けます。
import numpy as np
import matplotlib.pyplot as plt

fig = plt.figure()
fig.subplots_adjust(top=0.8)
ax1 = fig.add_subplot(211)
ax1.set_ylabel('volts')
ax1.set_title('a sine wave')

t = np.arange(0.0, 1.0, 0.01)
s = np.sin(2 * np.pi * t)
line, = ax1.plot(t, s, lw=2)

# Fixing random state for reproducibility
np.random.seed(19680801)

ax2 = fig.add_axes([0.15, 0.1, 0.7, 0.3])
n, bins, patches = ax2.hist(np.random.randn(1000), 50)
ax2.set_xlabel('time (s)')

plt.show()
参考文献
この例では、次の関数、メソッド、クラス、およびモジュールの使用が示されています。