ノート
完全なサンプルコードをダウンロードするには、ここをクリックしてください
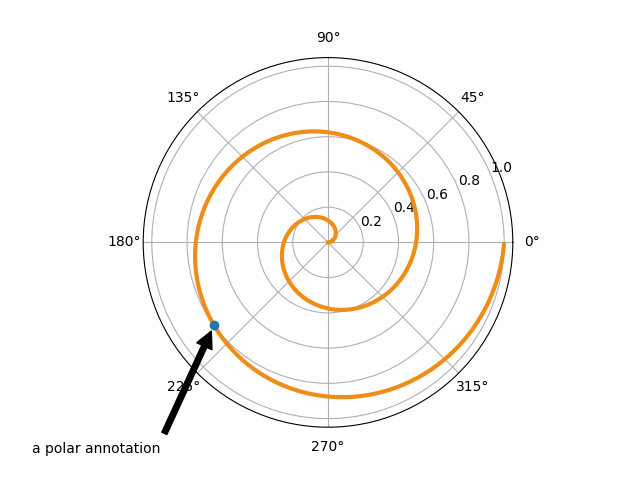
注釈の極性#
この例では、極グラフに注釈を作成する方法を示します。
注釈機能の完全な概要については、 注釈チュートリアルも参照してください。
import numpy as np
import matplotlib.pyplot as plt

fig = plt.figure()
ax = fig.add_subplot(projection='polar')
r = np.arange(0, 1, 0.001)
theta = 2 * 2*np.pi * r
line, = ax.plot(theta, r, color='#ee8d18', lw=3)

ind = 800
thisr, thistheta = r[ind], theta[ind]
ax.plot([thistheta], [thisr], 'o')
ax.annotate('a polar annotation',
            xy=(thistheta, thisr),  # theta, radius
            xytext=(0.05, 0.05),    # fraction, fraction
            textcoords='figure fraction',
            arrowprops=dict(facecolor='black', shrink=0.05),
            horizontalalignment='left',
            verticalalignment='bottom',
            )
plt.show()
参考文献
この例では、次の関数、メソッド、クラス、およびモジュールの使用が示されています。