ノート
完全なサンプルコードをダウンロードするには、ここをクリックしてください
軸ボックス アスペクト#
このデモでは、Axes ボックスのアスペクトを を介して直接設定する方法を示します
set_box_aspect。ボックスのアスペクトは、データ制限とは関係なく、物理単位での軸の高さと軸の幅の比率です。これは、たとえば、含まれるデータに関係なく正方形のプロットを作成したり、(データ) アスペクトが固定された画像プロットの隣に同じ軸次元の通常のプロットを作成したりするのに役立ちます。
のいくつかの使用例を次に示しますset_box_aspect。
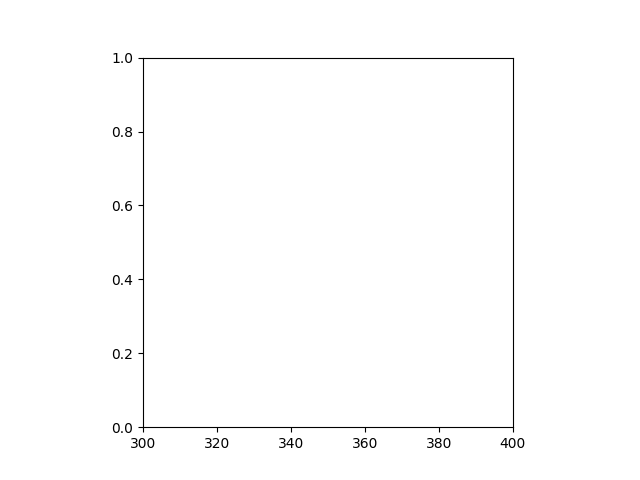
データに依存しない正方形の軸#
データの制限に関係なく、正方形の軸を生成します。
import numpy as np
import matplotlib.pyplot as plt

fig1, ax = plt.subplots()

ax.set_xlim(300, 400)
ax.set_box_aspect(1)

plt.show()
角二軸#
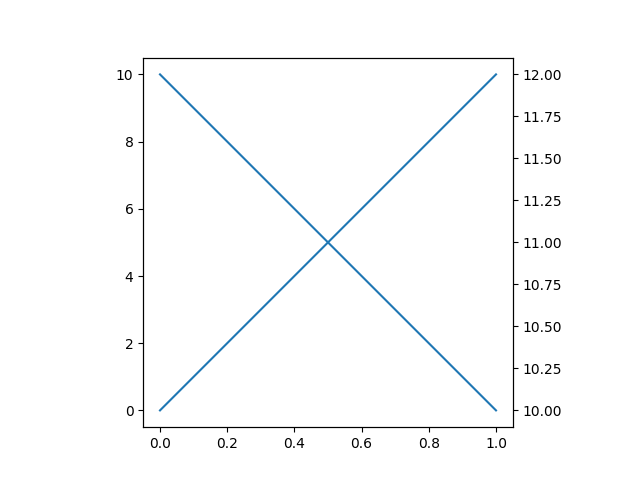
双軸で角軸を製作。対になった軸は、親のボックスの側面を引き継ぎます。
fig3, ax = plt.subplots()

ax2 = ax.twinx()

ax.plot([0, 10])
ax2.plot([12, 10])

ax.set_box_aspect(1)

plt.show()
画像の横にある通常のプロット#
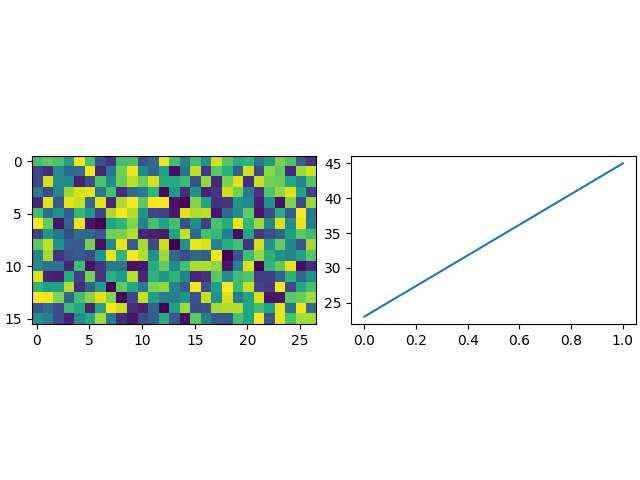
固定データ アスペクトと通常のプロットの横にあるデフォルトでイメージ プロットを作成すると
adjustable="box"、軸の高さが等しくなくなります。set_box_aspect通常のプロットの軸が画像の寸法をボックスのアスペクトとして使用できるようにすることで、これに対する簡単な解決策を提供します。
constrained_layoutこの例は、固定ボックスの側面とうまく相互作用することも示しています。
fig4, (ax, ax2) = plt.subplots(ncols=2, constrained_layout=True)

np.random.seed(19680801)  # Fixing random state for reproducibility
im = np.random.rand(16, 27)
ax.imshow(im)

ax2.plot([23, 45])
ax2.set_box_aspect(im.shape[0]/im.shape[1])

plt.show()
正方形ジョイント/限界プロット#
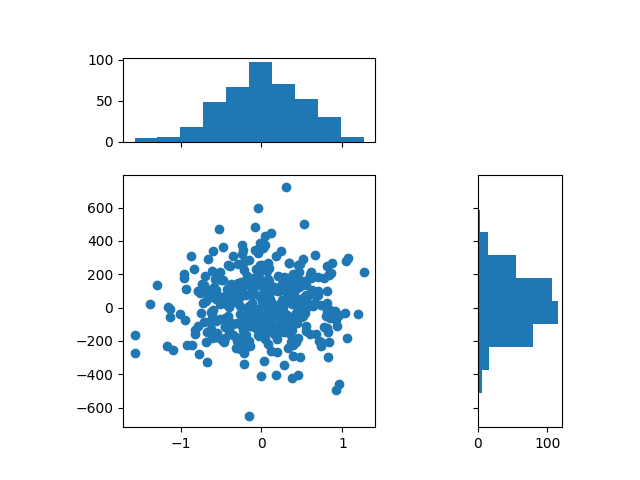
結合データのプロットの隣に周辺分布を表示することが望ましい場合があります。次の例では、周辺軸のボックス アスペクトが gridspec の幅と高さの比率に等しい正方形のプロットを作成します。これにより、Figure のサイズに関係なく、すべての軸が完全に整列します。
fig5, axs = plt.subplots(2, 2, sharex="col", sharey="row",
                         gridspec_kw=dict(height_ratios=[1, 3],
                                          width_ratios=[3, 1]))
axs[0, 1].set_visible(False)
axs[0, 0].set_box_aspect(1/3)
axs[1, 0].set_box_aspect(1)
axs[1, 1].set_box_aspect(3/1)

np.random.seed(19680801)  # Fixing random state for reproducibility
x, y = np.random.randn(2, 400) * [[.5], [180]]
axs[1, 0].scatter(x, y)
axs[0, 0].hist(x)
axs[1, 1].hist(y, orientation="horizontal")

plt.show()
正方形ジョイント/限界プロット#
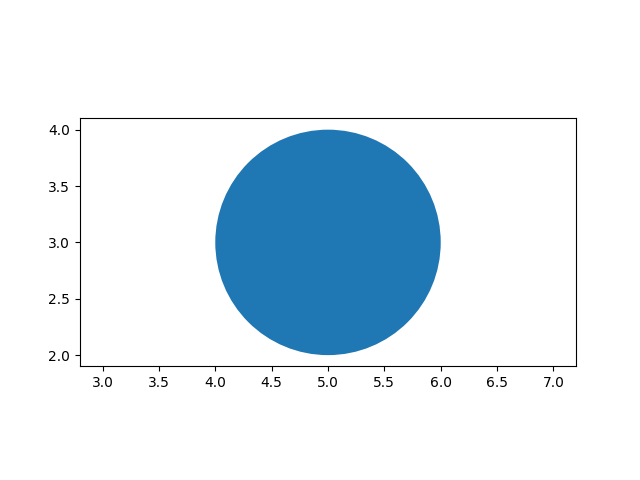
ボックスのアスペクトを設定する場合、データのアスペクトも設定できます。ここでは、高さの 2 倍の長さのボックスを持つ Axes を作成し、その内容に「等しい」データ アスペクトを使用します。つまり、円は実際には円形のままです。
fig6, ax = plt.subplots()

ax.add_patch(plt.Circle((5, 3), 1))
ax.set_aspect("equal", adjustable="datalim")
ax.set_box_aspect(0.5)
ax.autoscale()

plt.show()
多くのサブプロットのボックスアスペクト#
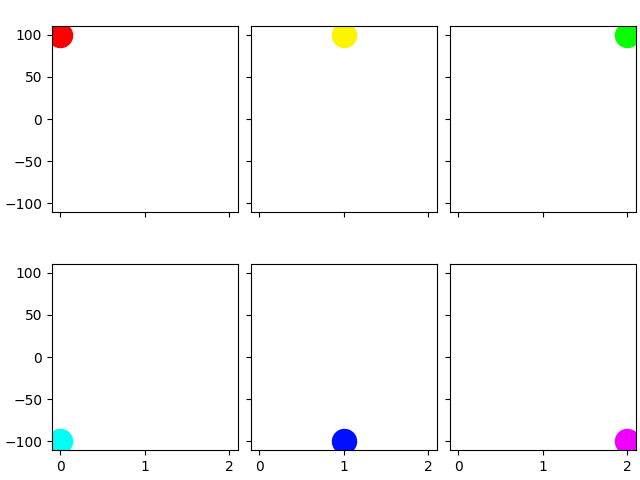
初期化時にボックス アスペクトを Axes に渡すことができます。以下は、すべて正方形の Axes を持つ 2 x 3 のサブプロット グリッドを作成します。
fig7, axs = plt.subplots(2, 3, subplot_kw=dict(box_aspect=1),
                         sharex=True, sharey=True, constrained_layout=True)

for i, ax in enumerate(axs.flat):
    ax.scatter(i % 3, -((i // 3) - 0.5)*200, c=[plt.cm.hsv(i / 6)], s=300)
plt.show()
スクリプトの合計実行時間: ( 0 分 2.779 秒)
