ノート
完全なサンプルコードをダウンロードするには、ここをクリックしてください
Betweenx デモを埋める#
fill_betweenx2 つの曲線の間の水平方向に沿って色を付けるために使用します。
import matplotlib.pyplot as plt
import numpy as np


y = np.arange(0.0, 2, 0.01)
x1 = np.sin(2 * np.pi * y)
x2 = 1.2 * np.sin(4 * np.pi * y)

fig, [ax1, ax2, ax3] = plt.subplots(1, 3, sharey=True, figsize=(6, 6))

ax1.fill_betweenx(y, 0, x1)
ax1.set_title('between (x1, 0)')

ax2.fill_betweenx(y, x1, 1)
ax2.set_title('between (x1, 1)')
ax2.set_xlabel('x')

ax3.fill_betweenx(y, x1, x2)
ax3.set_title('between (x1, x2)')

Text(0.5, 1.0, 'between (x1, x2)')
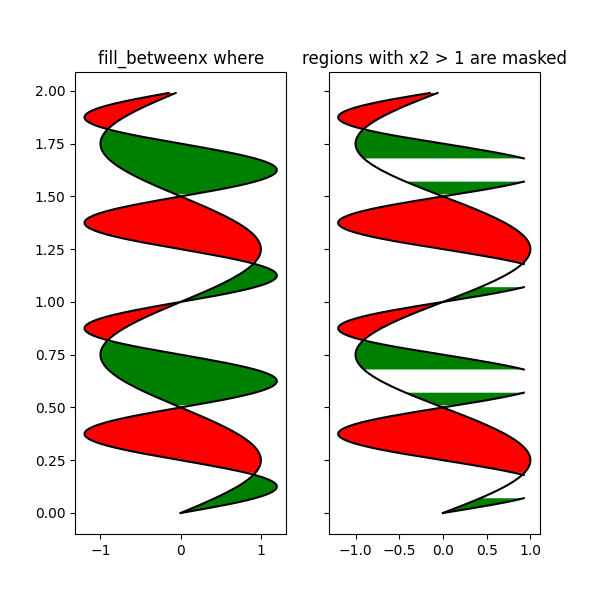
ここで、論理条件が満たされる x1 と x2 の間を埋めます。これは呼び出しとは異なることに注意してください。
複数の隣接領域にわたるエッジ効果のためです。
fig, [ax, ax1] = plt.subplots(1, 2, sharey=True, figsize=(6, 6))
ax.plot(x1, y, x2, y, color='black')
ax.fill_betweenx(y, x1, x2, where=x2 >= x1, facecolor='green')
ax.fill_betweenx(y, x1, x2, where=x2 <= x1, facecolor='red')
ax.set_title('fill_betweenx where')

# Test support for masked arrays.
x2 = np.ma.masked_greater(x2, 1.0)
ax1.plot(x1, y, x2, y, color='black')
ax1.fill_betweenx(y, x1, x2, where=x2 >= x1, facecolor='green')
ax1.fill_betweenx(y, x1, x2, where=x2 <= x1, facecolor='red')
ax1.set_title('regions with x2 > 1 are masked')
Text(0.5, 1.0, 'regions with x2 > 1 are masked')
この例は問題を示しています。データのグリッドが原因で、クロスオーバー ポイントに望ましくない塗りつぶされていない三角形があります。強引な解決策は、プロットする前にすべての配列を非常に細かいグリッドに補間することです。
plt.show()
スクリプトの合計実行時間: ( 0 分 1.113 秒)