ノート
完全なサンプルコードをダウンロードするには、ここをクリックしてください
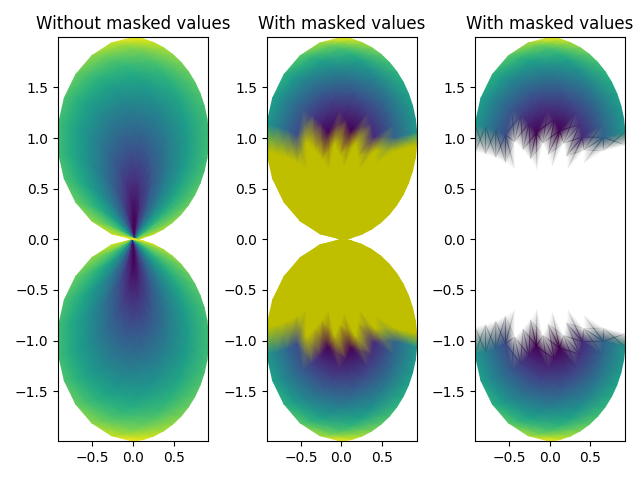
QuadMesh デモ#
pcolormeshQuadMeshをより高速に一般化した を使用しますpcolorが、いくつかの制限があります。
このデモは、マスクされたデータを使用した quadmesh のバグを示しています。
from matplotlib import pyplot as plt
import numpy as np

n = 12
x = np.linspace(-1.5, 1.5, n)
y = np.linspace(-1.5, 1.5, n * 2)
X, Y = np.meshgrid(x, y)
Qx = np.cos(Y) - np.cos(X)
Qz = np.sin(Y) + np.sin(X)
Z = np.sqrt(X**2 + Y**2) / 5
Z = (Z - Z.min()) / (Z.max() - Z.min())

# The color array can include masked values.
Zm = np.ma.masked_where(np.abs(Qz) < 0.5 * np.max(Qz), Z)

fig, axs = plt.subplots(nrows=1, ncols=3)
axs[0].pcolormesh(Qx, Qz, Z, shading='gouraud')
axs[0].set_title('Without masked values')

# You can control the color of the masked region.
cmap = plt.colormaps[plt.rcParams['image.cmap']].with_extremes(bad='y')
axs[1].pcolormesh(Qx, Qz, Zm, shading='gouraud', cmap=cmap)
axs[1].set_title('With masked values')

# Or use the default, which is transparent.
axs[2].pcolormesh(Qx, Qz, Zm, shading='gouraud')
axs[2].set_title('With masked values')

fig.tight_layout()
plt.show()
参考文献
この例では、次の関数、メソッド、クラス、およびモジュールの使用が示されています。
スクリプトの合計実行時間: ( 0 分 1.257 秒)