ノート
完全なサンプルコードをダウンロードするには、ここをクリックしてください
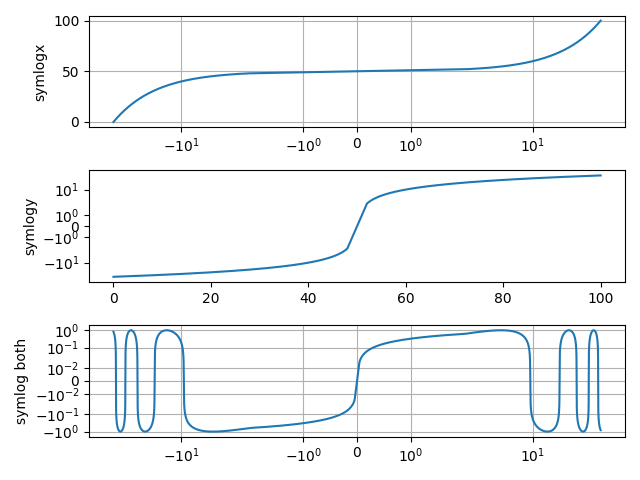
Symlog デモ#
symlog (対称対数) 軸スケーリングの使用例。
import matplotlib.pyplot as plt
import numpy as np

dt = 0.01
x = np.arange(-50.0, 50.0, dt)
y = np.arange(0, 100.0, dt)

fig, (ax0, ax1, ax2) = plt.subplots(nrows=3)

ax0.plot(x, y)
ax0.set_xscale('symlog')
ax0.set_ylabel('symlogx')
ax0.grid()
ax0.xaxis.grid(which='minor')  # minor grid on too

ax1.plot(y, x)
ax1.set_yscale('symlog')
ax1.set_ylabel('symlogy')

ax2.plot(x, np.sin(x / 3.0))
ax2.set_xscale('symlog')
ax2.set_yscale('symlog', linthresh=0.015)
ax2.grid()
ax2.set_ylabel('symlog both')

fig.tight_layout()
plt.show()
symlog
で使用される座標変換は、線形領域と対数領域の間の遷移で不連続な勾配を持つことに注意してください。軸スケールは、asinhこれらの不連続性によって引き起こされる視覚的なアーティファクトを回避できる代替手法です。
参考文献