ノート
完全なサンプルコードをダウンロードするには、ここをクリックしてください
バー ラベル デモ#
この例では、bar_labelヘルパー関数を使用して棒グラフ ラベルを作成する方法を示します。
集合棒グラフ、 積み上げ棒グラフ、 横棒グラフの例も参照してください。
import matplotlib.pyplot as plt
import numpy as np
データを定義する
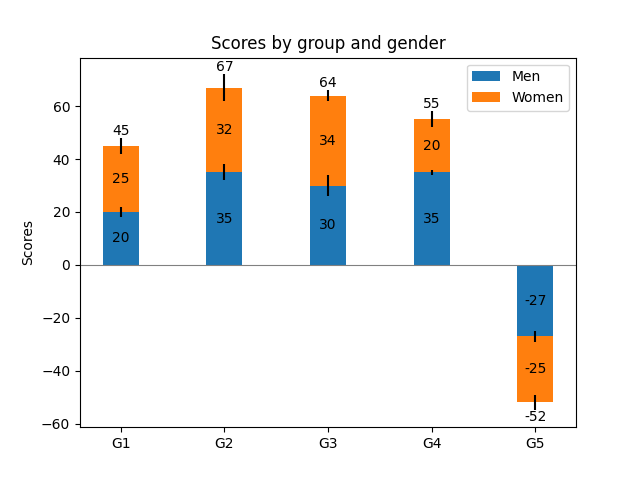
エラーバー付き積み上げ棒グラフ
fig, ax = plt.subplots()

p1 = ax.bar(ind, menMeans, width, yerr=menStd, label='Men')
p2 = ax.bar(ind, womenMeans, width,
            bottom=menMeans, yerr=womenStd, label='Women')

ax.axhline(0, color='grey', linewidth=0.8)
ax.set_ylabel('Scores')
ax.set_title('Scores by group and gender')
ax.set_xticks(ind, labels=['G1', 'G2', 'G3', 'G4', 'G5'])
ax.legend()

# Label with label_type 'center' instead of the default 'edge'
ax.bar_label(p1, label_type='center')
ax.bar_label(p2, label_type='center')
ax.bar_label(p2)

plt.show()
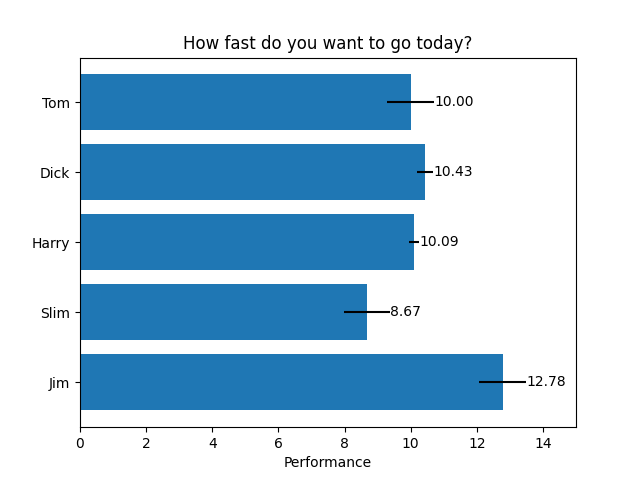
横棒グラフ
# Fixing random state for reproducibility
np.random.seed(19680801)

# Example data
people = ('Tom', 'Dick', 'Harry', 'Slim', 'Jim')
y_pos = np.arange(len(people))
performance = 3 + 10 * np.random.rand(len(people))
error = np.random.rand(len(people))

fig, ax = plt.subplots()

hbars = ax.barh(y_pos, performance, xerr=error, align='center')
ax.set_yticks(y_pos, labels=people)
ax.invert_yaxis()  # labels read top-to-bottom
ax.set_xlabel('Performance')
ax.set_title('How fast do you want to go today?')

# Label with specially formatted floats
ax.bar_label(hbars, fmt='%.2f')
ax.set_xlim(right=15)  # adjust xlim to fit labels

plt.show()
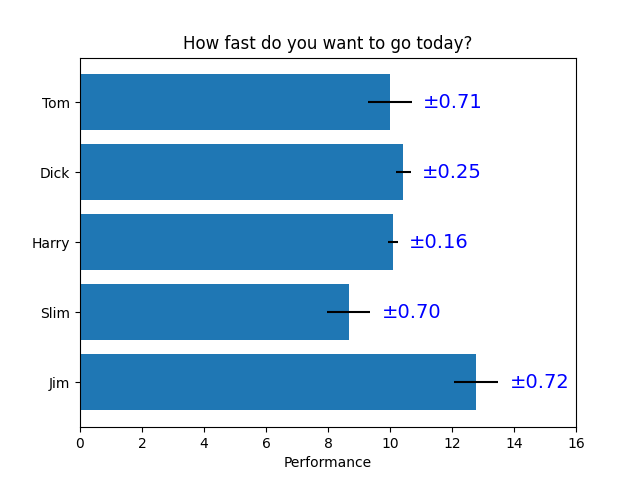
バーのラベルでできるより高度なことのいくつか
fig, ax = plt.subplots()

hbars = ax.barh(y_pos, performance, xerr=error, align='center')
ax.set_yticks(y_pos, labels=people)
ax.invert_yaxis()  # labels read top-to-bottom
ax.set_xlabel('Performance')
ax.set_title('How fast do you want to go today?')

# Label with given captions, custom padding and annotate options
ax.bar_label(hbars, labels=['±%.2f' % e for e in error],
             padding=8, color='b', fontsize=14)
ax.set_xlim(right=16)

plt.show()
参考文献
この例では、次の関数、メソッド、クラス、およびモジュールの使用が示されています。
スクリプトの合計実行時間: ( 0 分 1.010 秒)