ノート
完全なサンプルコードをダウンロードするには、ここをクリックしてください
ティックフォーマッタ#
目盛りフォーマッタは、軸の目盛りに関連付けられた数値を文字列としてフォーマットする方法を定義します。
この例は、最も一般的なフォーマッタの使用法と効果を示しています。
import matplotlib.pyplot as plt
from matplotlib import ticker


def setup(ax, title):
    """Set up common parameters for the Axes in the example."""
    # only show the bottom spine
    ax.yaxis.set_major_locator(ticker.NullLocator())
    ax.spines.right.set_color('none')
    ax.spines.left.set_color('none')
    ax.spines.top.set_color('none')

    # define tick positions
    ax.xaxis.set_major_locator(ticker.MultipleLocator(1.00))
    ax.xaxis.set_minor_locator(ticker.MultipleLocator(0.25))

    ax.xaxis.set_ticks_position('bottom')
    ax.tick_params(which='major', width=1.00, length=5)
    ax.tick_params(which='minor', width=0.75, length=2.5, labelsize=10)
    ax.set_xlim(0, 5)
    ax.set_ylim(0, 1)
    ax.text(0.0, 0.2, title, transform=ax.transAxes,
            fontsize=14, fontname='Monospace', color='tab:blue')
str
ティック フォーマッタは、または 関数をset_major_formatterまたはに渡すか、さまざまなクラスset_minor_formatterのいずれかのインスタンスを作成してまたは
に提供するという2 つの方法のいずれかで設定できます。Formatterset_major_formatterset_minor_formatter
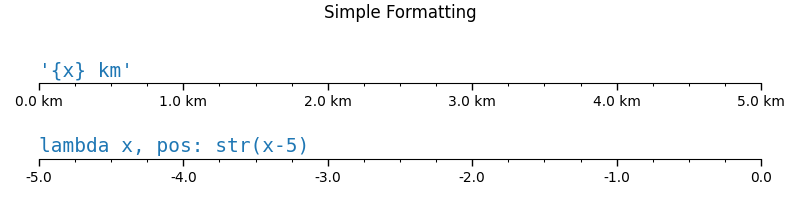
str最初の 2 つの例では、 or 関数を直接渡しています。
fig0, axs0 = plt.subplots(2, 1, figsize=(8, 2))
fig0.suptitle('Simple Formatting')

# A ``str``, using format string function syntax, can be used directly as a
# formatter.  The variable ``x`` is the tick value and the variable ``pos`` is
# tick position.  This creates a StrMethodFormatter automatically.
setup(axs0[0], title="'{x} km'")
axs0[0].xaxis.set_major_formatter('{x} km')

# A function can also be used directly as a formatter. The function must take
# two arguments: ``x`` for the tick value and ``pos`` for the tick position,
# and must return a ``str``. This creates a FuncFormatter automatically.
setup(axs0[1], title="lambda x, pos: str(x-5)")
axs0[1].xaxis.set_major_formatter(lambda x, pos: str(x-5))

fig0.tight_layout()
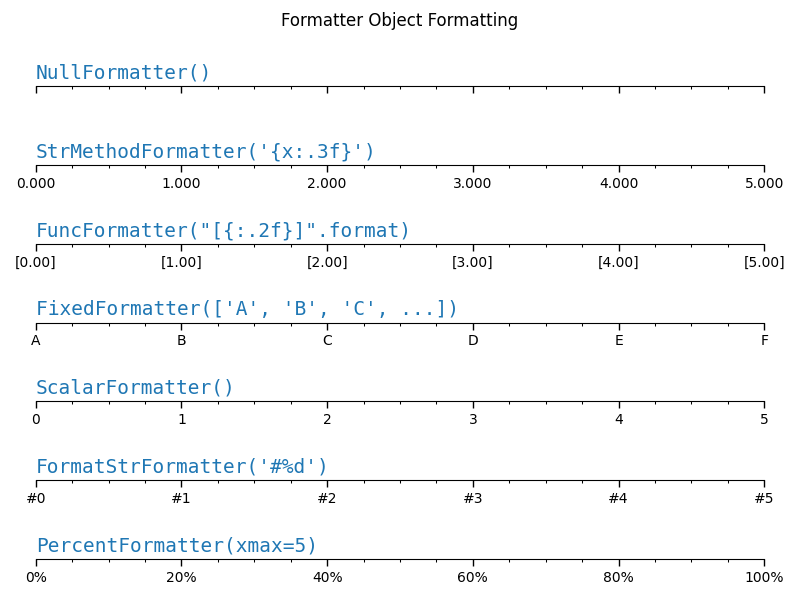
残りの例では、Formatterオブジェクトを使用しています。
fig1, axs1 = plt.subplots(7, 1, figsize=(8, 6))
fig1.suptitle('Formatter Object Formatting')

# Null formatter
setup(axs1[0], title="NullFormatter()")
axs1[0].xaxis.set_major_formatter(ticker.NullFormatter())

# StrMethod formatter
setup(axs1[1], title="StrMethodFormatter('{x:.3f}')")
axs1[1].xaxis.set_major_formatter(ticker.StrMethodFormatter("{x:.3f}"))


# FuncFormatter can be used as a decorator
@ticker.FuncFormatter
def major_formatter(x, pos):
    return f'[{x:.2f}]'


setup(axs1[2], title='FuncFormatter("[{:.2f}]".format)')
axs1[2].xaxis.set_major_formatter(major_formatter)

# Fixed formatter
setup(axs1[3], title="FixedFormatter(['A', 'B', 'C', ...])")
# FixedFormatter should only be used together with FixedLocator.
# Otherwise, one cannot be sure where the labels will end up.
positions = [0, 1, 2, 3, 4, 5]
labels = ['A', 'B', 'C', 'D', 'E', 'F']
axs1[3].xaxis.set_major_locator(ticker.FixedLocator(positions))
axs1[3].xaxis.set_major_formatter(ticker.FixedFormatter(labels))

# Scalar formatter
setup(axs1[4], title="ScalarFormatter()")
axs1[4].xaxis.set_major_formatter(ticker.ScalarFormatter(useMathText=True))

# FormatStr formatter
setup(axs1[5], title="FormatStrFormatter('#%d')")
axs1[5].xaxis.set_major_formatter(ticker.FormatStrFormatter("#%d"))

# Percent formatter
setup(axs1[6], title="PercentFormatter(xmax=5)")
axs1[6].xaxis.set_major_formatter(ticker.PercentFormatter(xmax=5))

fig1.tight_layout()
plt.show()
参考文献
この例では、次の関数、メソッド、クラス、およびモジュールの使用が示されています。
スクリプトの合計実行時間: ( 0 分 1.187 秒)