ノート
完全なサンプルコードをダウンロードするには、ここをクリックしてください
margin と sticky_edges を使用してビュー制限を制御する#
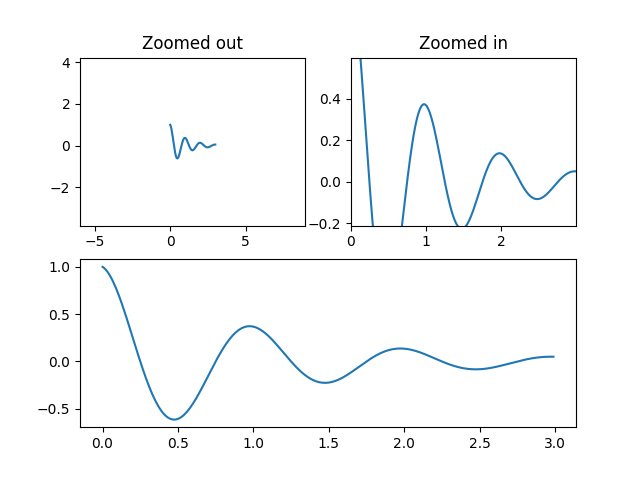
この例の最初の図は、 と の代わりに を使用して、プロットをズームインおよびズームアウトする方法を示してい
marginsます。2 番目の図は、特定の方法やアーティストによって導入されたエッジの「粘着性」の概念と、それを効果的に回避する方法を示しています。set_xlimset_ylim
import numpy as np
import matplotlib.pyplot as plt
from matplotlib.patches import Polygon


def f(t):
    return np.exp(-t) * np.cos(2*np.pi*t)


t1 = np.arange(0.0, 3.0, 0.01)

ax1 = plt.subplot(212)
ax1.margins(0.05)           # Default margin is 0.05, value 0 means fit
ax1.plot(t1, f(t1))

ax2 = plt.subplot(221)
ax2.margins(2, 2)           # Values >0.0 zoom out
ax2.plot(t1, f(t1))
ax2.set_title('Zoomed out')

ax3 = plt.subplot(222)
ax3.margins(x=0, y=-0.25)   # Values in (-0.5, 0.0) zooms in to center
ax3.plot(t1, f(t1))
ax3.set_title('Zoomed in')

plt.show()
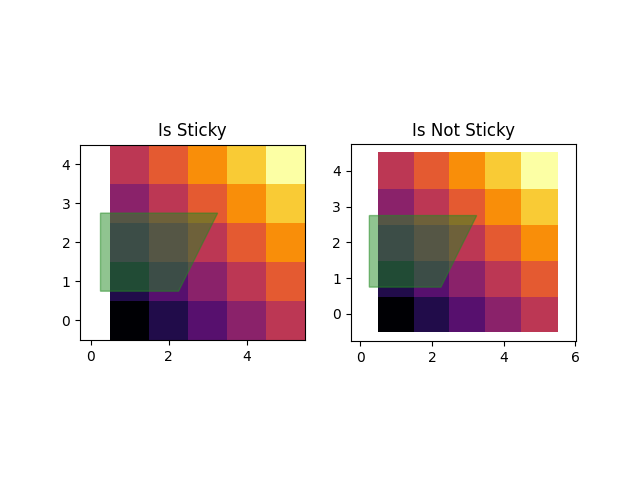
特定のプロット方法の「粘着性」について#
一部のプロット関数は、軸の範囲を「固定」するか、メソッドの意志に影響されないようにしmarginsます。たとえばimshow、
pcolorプロットに表示されているピクセルの周囲で制限を厳しくすることをユーザーが望んでいるとします。この動作が望ましくない場合は、 に設定する必要があり
use_sticky_edgesますFalse。次の例を検討してください。
y, x = np.mgrid[:5, 1:6]
poly_coords = [
    (0.25, 2.75), (3.25, 2.75),
    (2.25, 0.75), (0.25, 0.75)
]
fig, (ax1, ax2) = plt.subplots(ncols=2)

# Here we set the stickiness of the axes object...
# ax1 we'll leave as the default, which uses sticky edges
# and we'll turn off stickiness for ax2
ax2.use_sticky_edges = False

for ax, status in zip((ax1, ax2), ('Is', 'Is Not')):
    cells = ax.pcolor(x, y, x+y, cmap='inferno', shading='auto')  # sticky
    ax.add_patch(
        Polygon(poly_coords, color='forestgreen', alpha=0.5)
    )  # not sticky
    ax.margins(x=0.1, y=0.05)
    ax.set_aspect('equal')
    ax.set_title('{} Sticky'.format(status))

plt.show()
参考文献
この例では、次の関数、メソッド、クラス、およびモジュールの使用が示されています。