ノート
完全なサンプルコードをダウンロードするには、ここをクリックしてください
#を使用して複数のサブプロットを作成するplt.subplots
pyplot.subplots個々のプロットの作成方法を適切に制御しながら、1 回の呼び出しで Figure とサブプロットのグリッドを作成します。より高度なユース ケースGridSpecでは、より一般的なサブプロット レイアウトに使用したりFigure.add_subplot、Figure 内の任意の場所にサブプロットを追加したりできます。
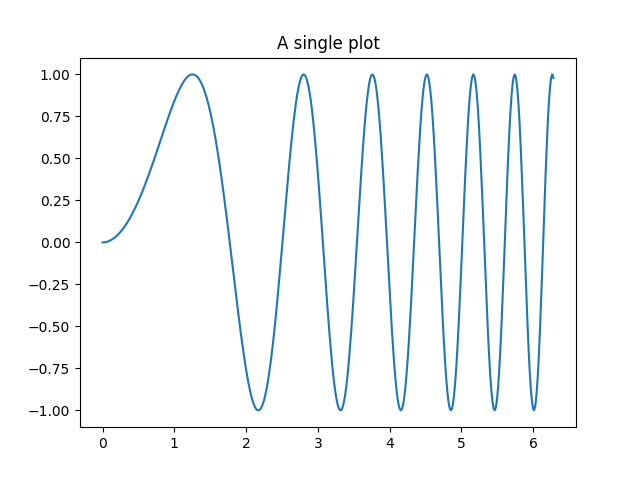
サブプロットが 1 つだけの図#
subplots()引数なしの場合、 aFigureと single
が返されますAxes。
これは、実際には、1 つの Figure と Axes を作成する最も簡単で推奨される方法です。
fig, ax = plt.subplots()
ax.plot(x, y)
ax.set_title('A single plot')
Text(0.5, 1.0, 'A single plot')
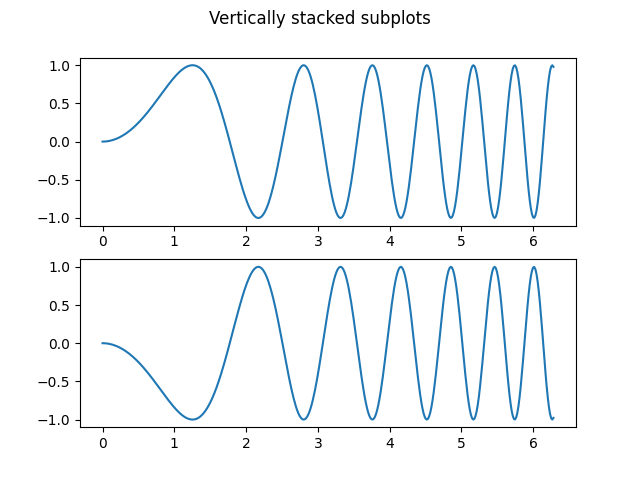
サブプロットを一方向に積み重ねる#
の最初の 2 つのオプション引数はpyplot.subplots、サブプロット グリッドの行数と列数を定義します。
一方向のみに積み重ねる場合、返さaxsれるのは、作成された Axes のリストを含む 1D numpy 配列です。
fig, axs = plt.subplots(2)
fig.suptitle('Vertically stacked subplots')
axs[0].plot(x, y)
axs[1].plot(x, -y)
[<matplotlib.lines.Line2D object at 0x7f2d00efd510>]
少数の Axes のみを作成する場合は、それらを各 Axes 専用の変数にすぐに展開すると便利です。そうすればax1、より冗長な の代わりに使用できますaxs[0]。
fig, (ax1, ax2) = plt.subplots(2)
fig.suptitle('Vertically stacked subplots')
ax1.plot(x, y)
ax2.plot(x, -y)

[<matplotlib.lines.Line2D object at 0x7f2d00a95b70>]
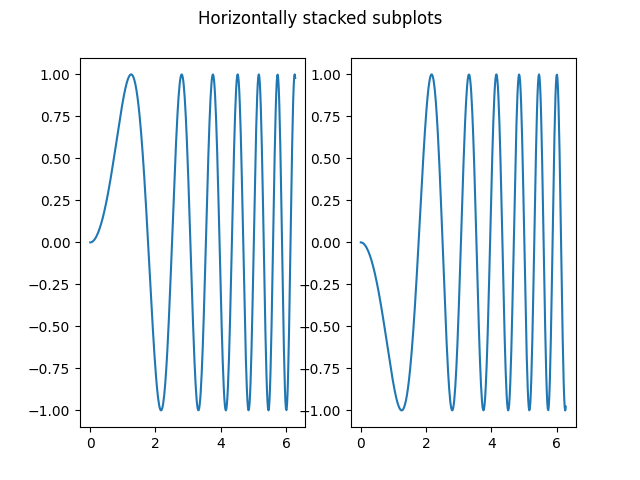
サブプロットを並べて取得するには、1 つの行と 2 つの列のパラメーターを渡します。1, 2
fig, (ax1, ax2) = plt.subplots(1, 2)
fig.suptitle('Horizontally stacked subplots')
ax1.plot(x, y)
ax2.plot(x, -y)
[<matplotlib.lines.Line2D object at 0x7f2cfb43d330>]
サブプロットを2方向に積み重ねる#
2 方向にスタックする場合、返さaxsれる は 2D NumPy 配列です。
サブプロットごとにパラメーターを設定する必要がある場合は、 を使用して 2D グリッド内のすべてのサブプロットを反復すると便利です。for ax in axs.flat:
fig, axs = plt.subplots(2, 2)
axs[0, 0].plot(x, y)
axs[0, 0].set_title('Axis [0, 0]')
axs[0, 1].plot(x, y, 'tab:orange')
axs[0, 1].set_title('Axis [0, 1]')
axs[1, 0].plot(x, -y, 'tab:green')
axs[1, 0].set_title('Axis [1, 0]')
axs[1, 1].plot(x, -y, 'tab:red')
axs[1, 1].set_title('Axis [1, 1]')

for ax in axs.flat:
    ax.set(xlabel='x-label', ylabel='y-label')

# Hide x labels and tick labels for top plots and y ticks for right plots.
for ax in axs.flat:
    ax.label_outer()
![軸 [0, 0]、軸 [0, 1]、軸 [1, 0]、軸 [1, 1]](/stable/_images/sphx_glr_subplots_demo_005.png)
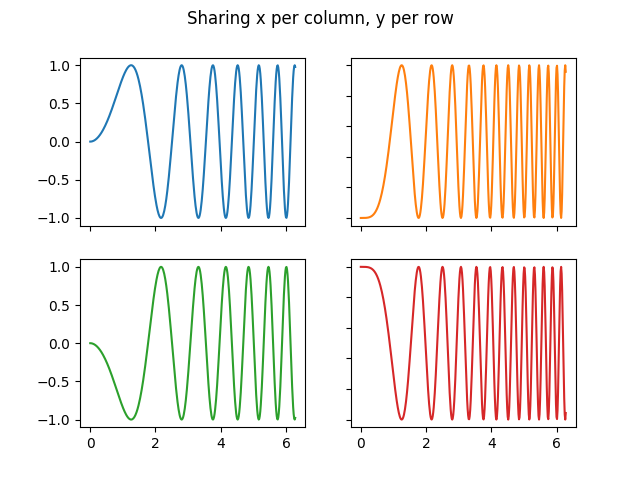
2D でもタプルアンパッキングを使用して、すべてのサブプロットを専用変数に割り当てることができます。
fig, ((ax1, ax2), (ax3, ax4)) = plt.subplots(2, 2)
fig.suptitle('Sharing x per column, y per row')
ax1.plot(x, y)
ax2.plot(x, y**2, 'tab:orange')
ax3.plot(x, -y, 'tab:green')
ax4.plot(x, -y**2, 'tab:red')

for ax in fig.get_axes():
    ax.label_outer()
共有軸#
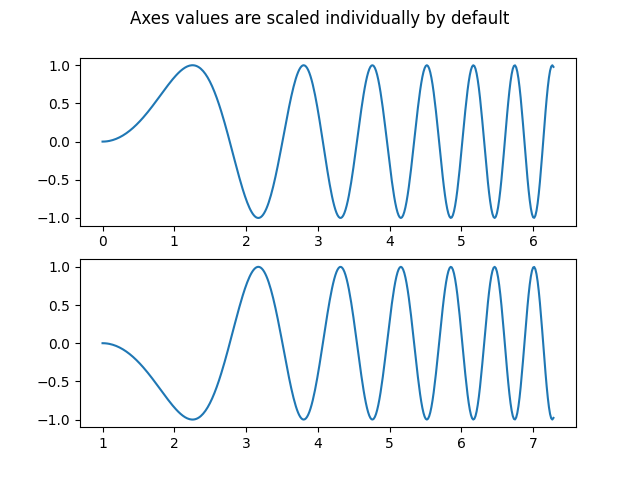
デフォルトでは、各軸は個別にスケーリングされます。したがって、範囲が異なる場合、サブプロットの目盛り値は整列しません。
fig, (ax1, ax2) = plt.subplots(2)
fig.suptitle('Axes values are scaled individually by default')
ax1.plot(x, y)
ax2.plot(x + 1, -y)
[<matplotlib.lines.Line2D object at 0x7f2cfb007250>]
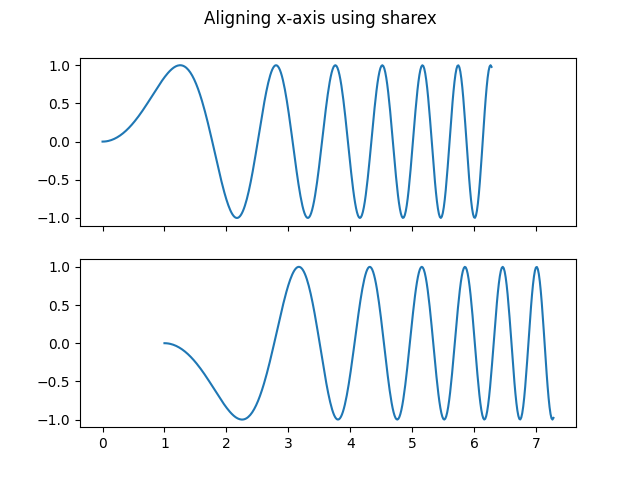
sharexまたはshareyを使用して、水平軸または垂直軸を揃えることができます。
fig, (ax1, ax2) = plt.subplots(2, sharex=True)
fig.suptitle('Aligning x-axis using sharex')
ax1.plot(x, y)
ax2.plot(x + 1, -y)
[<matplotlib.lines.Line2D object at 0x7f2cfa993370>]
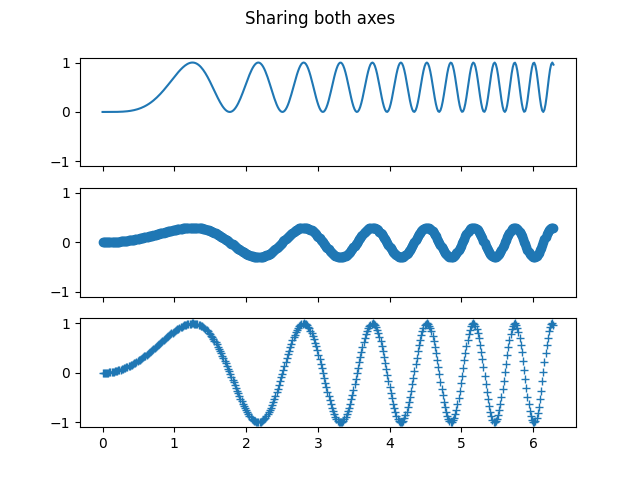
sharexまたはshareyを に設定Trueすると、グリッド全体でグローバル共有が有効になります。つまり、 を使用すると、垂直に積み重ねられたサブプロットの y 軸も同じスケールになりsharey=Trueます。
[<matplotlib.lines.Line2D object at 0x7f2cfab12980>]
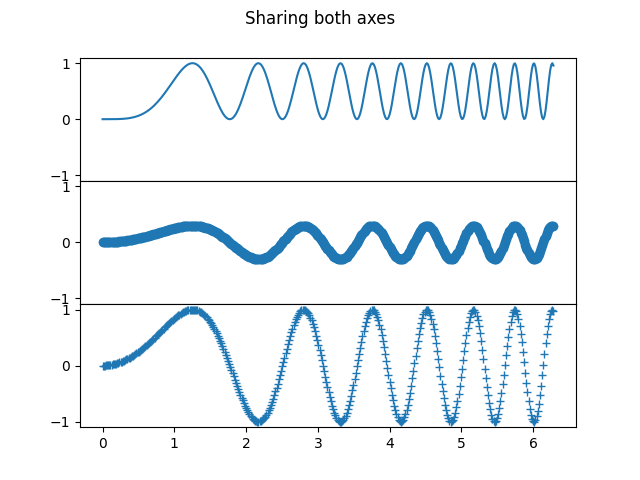
軸を共有しているサブプロットの場合、1 セットの目盛りラベルで十分です。内側の Axes の目盛りラベルは、sharexおよびshareyによって自動的に削除されます。サブプロット間に未使用の空きスペースが残っています。
サブプロットの位置を正確に制御するには、 with を明示的に作成GridSpecしFigure.add_gridspec、その
subplotsメソッドを呼び出します。たとえば、 を使用して垂直サブプロット間の高さを減らすことができadd_gridspec(hspace=0)ます。
label_outerグリッドの端にないサブプロットからラベルと目盛りを削除する便利な方法です。
fig = plt.figure()
gs = fig.add_gridspec(3, hspace=0)
axs = gs.subplots(sharex=True, sharey=True)
fig.suptitle('Sharing both axes')
axs[0].plot(x, y ** 2)
axs[1].plot(x, 0.3 * y, 'o')
axs[2].plot(x, y, '+')

# Hide x labels and tick labels for all but bottom plot.
for ax in axs:
    ax.label_outer()
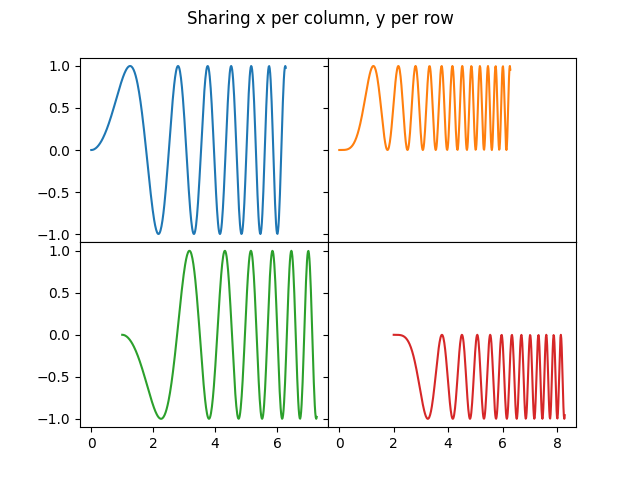
と を除いて、sharexTrueとshareyFalseの両方が値 'row' と 'col' を受け入れて、行または列ごとにのみ値を共有します。
fig = plt.figure()
gs = fig.add_gridspec(2, 2, hspace=0, wspace=0)
(ax1, ax2), (ax3, ax4) = gs.subplots(sharex='col', sharey='row')
fig.suptitle('Sharing x per column, y per row')
ax1.plot(x, y)
ax2.plot(x, y**2, 'tab:orange')
ax3.plot(x + 1, -y, 'tab:green')
ax4.plot(x + 2, -y**2, 'tab:red')

for ax in axs.flat:
    ax.label_outer()
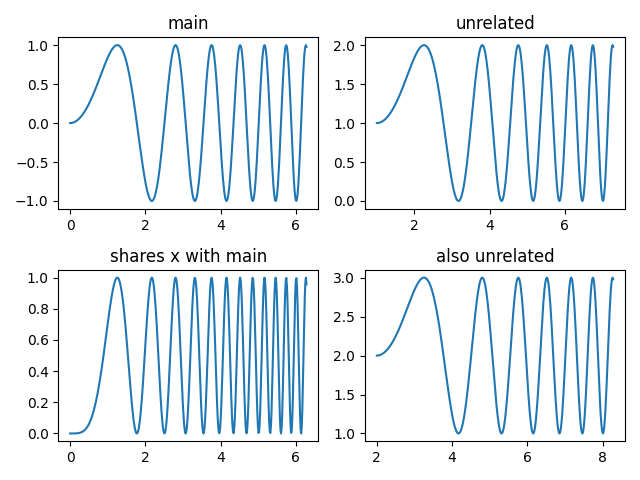
より複雑な共有構造が必要な場合は、最初に共有なしで軸のグリッドを作成してから、axes.Axes.sharexor
を呼び出しaxes.Axes.shareyて事後的に共有情報を追加できます。
fig, axs = plt.subplots(2, 2)
axs[0, 0].plot(x, y)
axs[0, 0].set_title("main")
axs[1, 0].plot(x, y**2)
axs[1, 0].set_title("shares x with main")
axs[1, 0].sharex(axs[0, 0])
axs[0, 1].plot(x + 1, y + 1)
axs[0, 1].set_title("unrelated")
axs[1, 1].plot(x + 2, y + 2)
axs[1, 1].set_title("also unrelated")
fig.tight_layout()
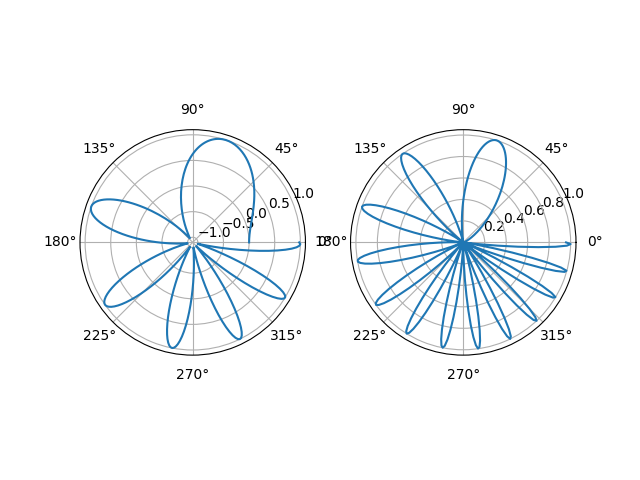
極軸#
のパラメーターsubplot_kwはpyplot.subplots、サブプロットのプロパティを制御します ( も参照Figure.add_subplot)。特に、極座標軸のグリッドを作成するために使用できます。
スクリプトの合計実行時間: ( 0 分 7.774 秒)