ノート
完全なサンプルコードをダウンロードするには、ここをクリックしてください
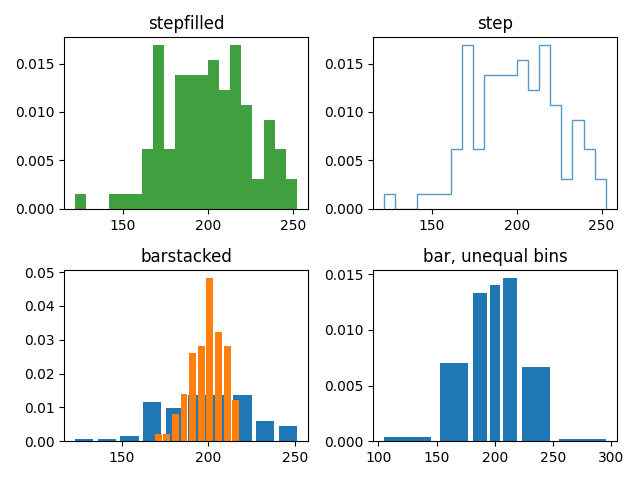
ヒストグラム関数のさまざまなhisttype設定のデモ#
色で塗りつぶされたステップ カーブを含むヒストグラム。
塗りつぶしのないステップ カーブのヒストグラム。
カスタムのビン幅が等しくないヒストグラム。
棒が積み上げられた 2 つのヒストグラム。
異なるビン数とサイズを選択すると、ヒストグラムの形状に大きな影響を与える可能性があります。Astropy のドキュメントには、これらのパラメーターを選択する方法に関する優れたセクションがあります: http://docs.astropy.org/en/stable/visualization/histogram.html
import numpy as np
import matplotlib.pyplot as plt

np.random.seed(19680801)

mu_x = 200
sigma_x = 25
x = np.random.normal(mu_x, sigma_x, size=100)

mu_w = 200
sigma_w = 10
w = np.random.normal(mu_w, sigma_w, size=100)

fig, axs = plt.subplots(nrows=2, ncols=2)

axs[0, 0].hist(x, 20, density=True, histtype='stepfilled', facecolor='g',
               alpha=0.75)
axs[0, 0].set_title('stepfilled')

axs[0, 1].hist(x, 20, density=True, histtype='step', facecolor='g',
               alpha=0.75)
axs[0, 1].set_title('step')

axs[1, 0].hist(x, density=True, histtype='barstacked', rwidth=0.8)
axs[1, 0].hist(w, density=True, histtype='barstacked', rwidth=0.8)
axs[1, 0].set_title('barstacked')

# Create a histogram by providing the bin edges (unequally spaced).
bins = [100, 150, 180, 195, 205, 220, 250, 300]
axs[1, 1].hist(x, bins, density=True, histtype='bar', rwidth=0.8)
axs[1, 1].set_title('bar, unequal bins')

fig.tight_layout()
plt.show()