ノート
完全なサンプルコードをダウンロードするには、ここをクリックしてください
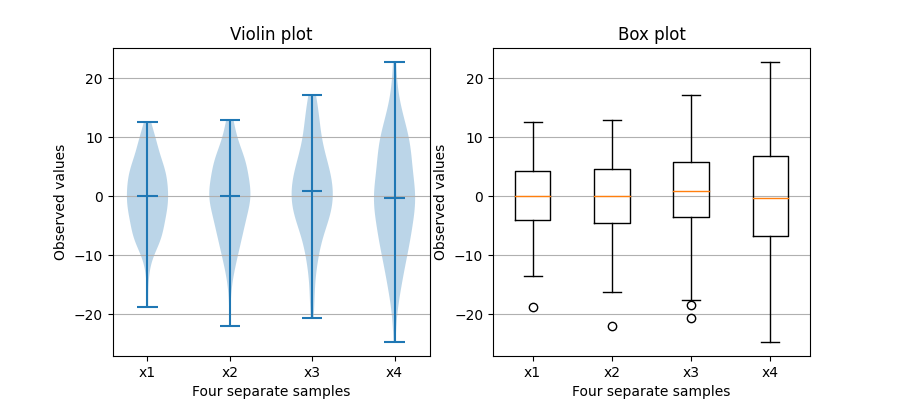
ボックス プロットとバイオリン プロットの比較#
バイオリン プロットは Tukey (1977) のボックス プロットと密接に関連していますが、サンプル データの分布 (密度トレース) などの有用な情報が追加されていることに注意してください。
デフォルトでは、ボックス プロットは 1.5 * 四分位範囲外のデータ ポイントをひげの上または下の外れ値として表示しますが、ヴァイオリン プロットはデータの全範囲を表示します。
箱ひげ図とその歴史に関する一般的なリファレンスは、 http ://vita.had.co.nz/papers/boxplots.pdf にあります。
ヴァイオリン プロットには、matplotlib >= 1.4 が必要です。
ヴァイオリン プロットの詳細については、scikit-learn ドキュメントにすばらしいセクションがあります: https://scikit-learn.org/stable/modules/density.html
import matplotlib.pyplot as plt
import numpy as np

fig, axs = plt.subplots(nrows=1, ncols=2, figsize=(9, 4))

# Fixing random state for reproducibility
np.random.seed(19680801)


# generate some random test data
all_data = [np.random.normal(0, std, 100) for std in range(6, 10)]

# plot violin plot
axs[0].violinplot(all_data,
                  showmeans=False,
                  showmedians=True)
axs[0].set_title('Violin plot')

# plot box plot
axs[1].boxplot(all_data)
axs[1].set_title('Box plot')

# adding horizontal grid lines
for ax in axs:
    ax.yaxis.grid(True)
    ax.set_xticks([y + 1 for y in range(len(all_data))],
                  labels=['x1', 'x2', 'x3', 'x4'])
    ax.set_xlabel('Four separate samples')
    ax.set_ylabel('Observed values')

plt.show()
参考文献
この例では、次の関数、メソッド、クラス、およびモジュールの使用が示されています。