ノート
完全なサンプルコードをダウンロードするには、ここをクリックしてください
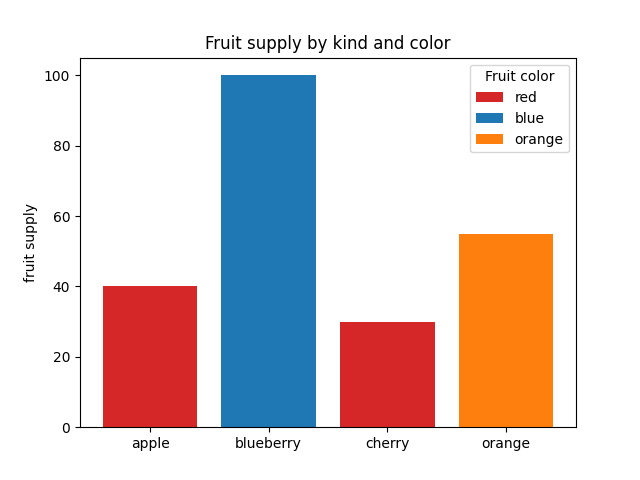
バーの色のデモ#
これは、 のcolorパラメータとlabelパラメータを使用してバーの色と凡例エントリを制御する方法を示す例ですbar。アンダースコアが先行するラベルは凡例に表示されないことに注意してください。
import matplotlib.pyplot as plt

fig, ax = plt.subplots()

fruits = ['apple', 'blueberry', 'cherry', 'orange']
counts = [40, 100, 30, 55]
bar_labels = ['red', 'blue', '_red', 'orange']
bar_colors = ['tab:red', 'tab:blue', 'tab:red', 'tab:orange']

ax.bar(fruits, counts, label=bar_labels, color=bar_colors)

ax.set_ylabel('fruit supply')
ax.set_title('Fruit supply by kind and color')
ax.legend(title='Fruit color')

plt.show()