ノート
完全なサンプルコードをダウンロードするには、ここをクリックしてください
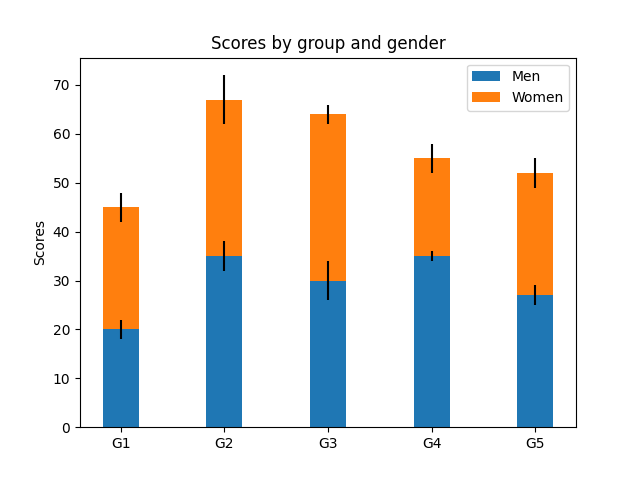
積み上げ棒グラフ#
これは、 を使用してエラー バー付きの積み上げ棒グラフを作成する例ですbar。パラメータyerrがエラー バーに使用され、bottomが女性のバーを男性のバーの上に重ねることに注意してください。
import matplotlib.pyplot as plt


labels = ['G1', 'G2', 'G3', 'G4', 'G5']
men_means = [20, 35, 30, 35, 27]
women_means = [25, 32, 34, 20, 25]
men_std = [2, 3, 4, 1, 2]
women_std = [3, 5, 2, 3, 3]
width = 0.35       # the width of the bars: can also be len(x) sequence

fig, ax = plt.subplots()

ax.bar(labels, men_means, width, yerr=men_std, label='Men')
ax.bar(labels, women_means, width, yerr=women_std, bottom=men_means,
       label='Women')

ax.set_ylabel('Scores')
ax.set_title('Scores by group and gender')
ax.legend()

plt.show()