ノート
完全なサンプルコードをダウンロードするには、ここをクリックしてください
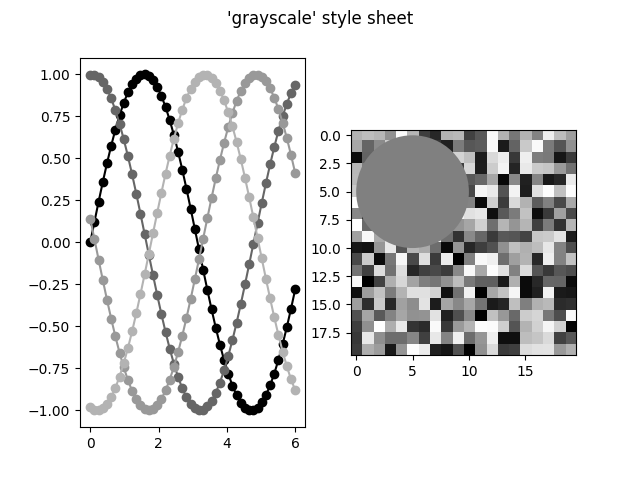
グレースケール スタイル シート#
この例は、グレースケールとして定義されているすべての色を変更する「グレースケール」スタイル シートを示していますrcParams。ただし、すべてのプロット要素が を尊重するわけではないことに注意してくださいrcParams。
import numpy as np
import matplotlib.pyplot as plt

# Fixing random state for reproducibility
np.random.seed(19680801)


def color_cycle_example(ax):
    L = 6
    x = np.linspace(0, L)
    ncolors = len(plt.rcParams['axes.prop_cycle'])
    shift = np.linspace(0, L, ncolors, endpoint=False)
    for s in shift:
        ax.plot(x, np.sin(x + s), 'o-')


def image_and_patch_example(ax):
    ax.imshow(np.random.random(size=(20, 20)), interpolation='none')
    c = plt.Circle((5, 5), radius=5, label='patch')
    ax.add_patch(c)


plt.style.use('grayscale')

fig, (ax1, ax2) = plt.subplots(ncols=2)
fig.suptitle("'grayscale' style sheet")

color_cycle_example(ax1)
image_and_patch_example(ax2)

plt.show()