ノート
完全なサンプルコードをダウンロードするには、ここをクリックしてください
等高線ラベルのデモ#
等高線ラベルで実行できる高度な操作をいくつか説明します。
輪郭デモの例も参照してください。
import numpy as np
import matplotlib.ticker as ticker
import matplotlib.pyplot as plt
表面を定義する
カスタム レベル フォーマッタで等高線ラベルを作成する
# This custom formatter removes trailing zeros, e.g. "1.0" becomes "1", and
# then adds a percent sign.
def fmt(x):
    s = f"{x:.1f}"
    if s.endswith("0"):
        s = f"{x:.0f}"
    return rf"{s} \%" if plt.rcParams["text.usetex"] else f"{s} %"


# Basic contour plot
fig, ax = plt.subplots()
CS = ax.contour(X, Y, Z)

ax.clabel(CS, CS.levels, inline=True, fmt=fmt, fontsize=10)

<a list of 7 text.Text objects>
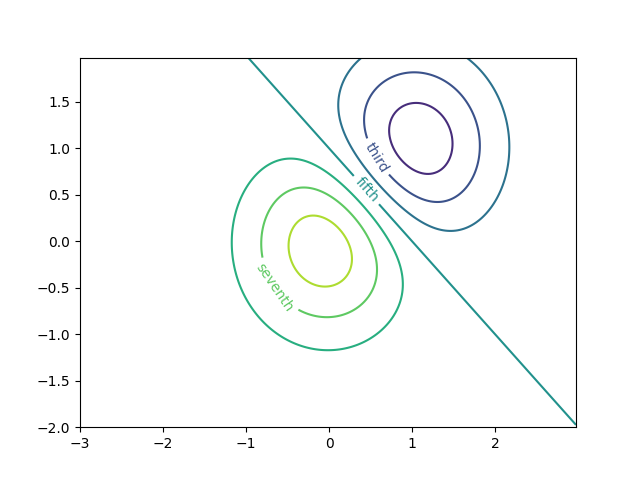
辞書を使用して任意の文字列で等高線にラベルを付ける
fig1, ax1 = plt.subplots()

# Basic contour plot
CS1 = ax1.contour(X, Y, Z)

fmt = {}
strs = ['first', 'second', 'third', 'fourth', 'fifth', 'sixth', 'seventh']
for l, s in zip(CS1.levels, strs):
    fmt[l] = s

# Label every other level using strings
ax1.clabel(CS1, CS1.levels[::2], inline=True, fmt=fmt, fontsize=10)
<a list of 3 text.Text objects>
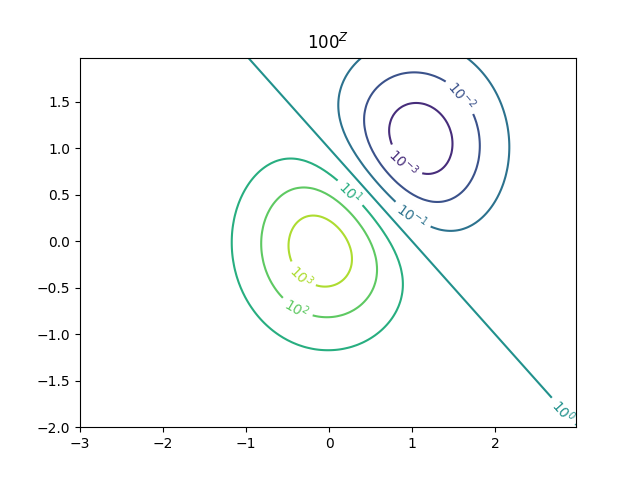
フォーマッターを使用する
fig2, ax2 = plt.subplots()

CS2 = ax2.contour(X, Y, 100**Z, locator=plt.LogLocator())
fmt = ticker.LogFormatterMathtext()
fmt.create_dummy_axis()
ax2.clabel(CS2, CS2.levels, fmt=fmt)
ax2.set_title("$100^Z$")

plt.show()
参考文献
この例では、次の関数、メソッド、クラス、およびモジュールの使用が示されています。
スクリプトの合計実行時間: ( 0 分 1.443 秒)