ノート
完全なサンプルコードをダウンロードするには、ここをクリックしてください
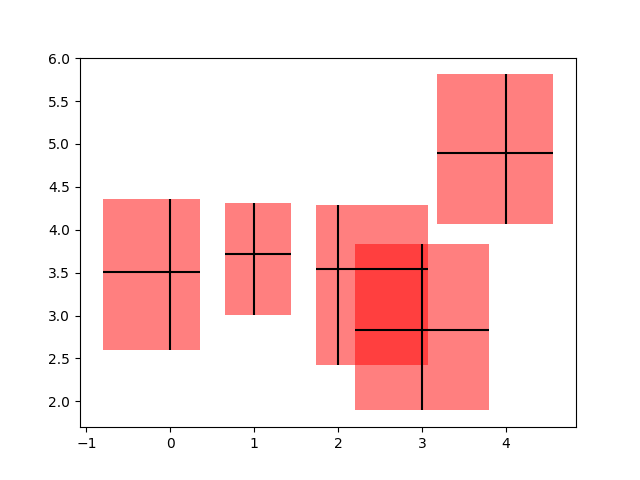
PatchCollection を使用してエラー バーからボックスを作成する#
この例では、x 方向と y 方向の両方のバーの限界によって定義された長方形のパッチを追加することで、かなり標準的なエラー バー プロットを作成します。これを行うには、 という独自のカスタム関数を作成する必要がありますmake_error_boxes。この関数を詳しく調べると、matplotlib の関数を記述する際に推奨されるパターンが明らかになります。
オブジェクト
Axesが関数に直接渡される関数は、インターフェイス
Axesを介さずに直接メソッドを操作しますpyplot省略可能なプロット キーワード引数は、後でコードを読みやすくするためにスペルアウトされます (たとえば、 fc の代わりにfacecolorを使用します) 。
次に、プロット メソッドによって返されたアーティスト
Axesが関数によって返されるため、必要に応じて後で関数の外部でスタイルを変更できます (この例では変更されていません)。
import numpy as np
import matplotlib.pyplot as plt
from matplotlib.collections import PatchCollection
from matplotlib.patches import Rectangle

# Number of data points
n = 5

# Dummy data
np.random.seed(19680801)
x = np.arange(0, n, 1)
y = np.random.rand(n) * 5.

# Dummy errors (above and below)
xerr = np.random.rand(2, n) + 0.1
yerr = np.random.rand(2, n) + 0.2


def make_error_boxes(ax, xdata, ydata, xerror, yerror, facecolor='r',
                     edgecolor='none', alpha=0.5):

    # Loop over data points; create box from errors at each point
    errorboxes = [Rectangle((x - xe[0], y - ye[0]), xe.sum(), ye.sum())
                  for x, y, xe, ye in zip(xdata, ydata, xerror.T, yerror.T)]

    # Create patch collection with specified colour/alpha
    pc = PatchCollection(errorboxes, facecolor=facecolor, alpha=alpha,
                         edgecolor=edgecolor)

    # Add collection to axes
    ax.add_collection(pc)

    # Plot errorbars
    artists = ax.errorbar(xdata, ydata, xerr=xerror, yerr=yerror,
                          fmt='none', ecolor='k')

    return artists


# Create figure and axes
fig, ax = plt.subplots(1)

# Call function to create error boxes
_ = make_error_boxes(ax, x, y, xerr, yerr)

plt.show()
参考文献
この例では、次の関数、メソッド、クラス、およびモジュールの使用が示されています。