API リファレンス#
ライブラリを使用する場合、通常は FigureおよびAxesオブジェクトを作成し、それらのメソッドを呼び出してコンテンツを追加し、外観を変更します。
matplotlib.figure: 軸の作成、Figure レベルのコンテンツmatplotlib.axes: ほとんどのプロット方法、軸ラベル、軸スタイルへのアクセスなど。
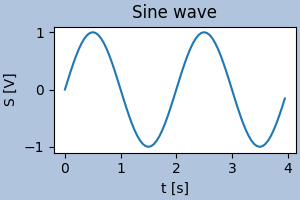
例: Figurefigと Axesを作成しますax。次に、それらのメソッドを呼び出してデータをプロットし、軸ラベルと Figure タイトルを追加します。
import matplotlib.pyplot as plt
import numpy as np

x = np.arange(0, 4, 0.05)
y = np.sin(x*np.pi)

fig, ax = plt.subplots(figsize=(3,2), constrained_layout=True)
ax.plot(x, y)
ax.set_xlabel('t [s]')
ax.set_ylabel('S [V]')
ax.set_title('Sine wave')
fig.set_facecolor('lightsteelblue')
使用パターン#
以下では、Matplotlib を使用してプロットするためのいくつかの一般的なアプローチについて説明します。サポートされているユーザー API 間のトレードオフの説明については、Matplotlib アプリケーション インターフェイス (API)を参照してください 。
明示的な API #
その核となるのは、Matplotlib はオブジェクト指向ライブラリです。プロットをさらに制御およびカスタマイズする必要がある場合は、オブジェクトを直接操作することをお勧めします。
多くの場合、 and を使用してFigureおよび 1 つ以上
を作成し、それ以降はこれらのオブジェクトでのみ作業します。ただし、 を明示的に作成することもできます (たとえば、GUI アプリケーションに含める場合)。Axespyplot.subplotsFigure
参考文献:
matplotlib.axes.Axesおよびmatplotlib.figure.Figureプロット関数の概要については。ほとんどの例では、オブジェクト指向のアプローチを使用しています (pyplot セクションを除く)。
暗黙の API #
matplotlib.pyplotMatplotlib を MATLAB のように機能させる関数のコレクションです。各 pyplot 関数は Figure に何らかの変更を加えます: たとえば、Figure を作成する、Figure にプロット領域を作成する、プロット領域にいくつかの線をプロットする、ラベルでプロットを装飾するなどです。
pyplot主にインタラクティブなプロットと、プログラムによるプロット生成の単純なケースを対象としています。
参考文献:
関数
matplotlib.pyplotリファレンス
pylab API (非推奨) #
警告
グローバル名前空間に頻繁にインポートすると予期しない動作が発生する可能性があるため、pylab の使用は強くお勧めしません。matplotlib.pyplot
代わりに使用してください。
pylab、、、、、およびいくつかの追加機能をすべて単一の名前空間内に含む
matplotlib.pyplotモジュールnumpyです。その本来の目的は、すべての関数をグローバル名前空間にインポートすることにより、MATLAB のような作業方法を模倣することでした。これは、今日では悪いスタイルと見なされています。numpy.fftnumpy.linalgnumpy.random
モジュール#
モジュールのアルファベット順リスト:
matplotlibmatplotlib.afmmatplotlib.animationmatplotlib.artistmatplotlib.axesmatplotlib.axismatplotlib.backend_basesmatplotlib.backend_managersmatplotlib.backend_toolsmatplotlib.backendsmatplotlib.beziermatplotlib.blocking_inputmatplotlib.categorymatplotlib.cbookmatplotlib.cmmatplotlib.collectionsmatplotlib.colorbarmatplotlib.colorsmatplotlib.containermatplotlib.contourmatplotlib.datesmatplotlib.docstringmatplotlib.dvireadmatplotlib.figurematplotlib.font_managermatplotlib.fontconfig_patternmatplotlib.ft2fontmatplotlib.gridspecmatplotlib.hatchmatplotlib.imagematplotlib.layout_enginematplotlib.legendmatplotlib.legend_handlermatplotlib.linesmatplotlib.markersmatplotlib.mathtextmatplotlib.mlabmatplotlib.offsetboxmatplotlib.patchesmatplotlib.pathmatplotlib.patheffectsmatplotlib.pyplotmatplotlib.projectionsmatplotlib.quivermatplotlib.rcsetupmatplotlib.sankeymatplotlib.scalematplotlib.sphinxext.mathmplmatplotlib.sphinxext.plot_directivematplotlib.spinesmatplotlib.stylematplotlib.tablematplotlib.testingmatplotlib.textmatplotlib.texmanagermatplotlib.textpathmatplotlib.tickermatplotlib.tight_bboxmatplotlib.tight_layoutmatplotlib.transformsmatplotlib.trimatplotlib.type1fontmatplotlib.unitsmatplotlib.widgetsmatplotlib._apimatplotlib._enumsmpl_toolkits.mplot3dmpl_toolkits.axes_grid1mpl_toolkits.axisartist