ノート
完全なサンプルコードをダウンロードするには、ここをクリックしてください
日付の精度とエポック#
Matplotlib は、これらの日付を認識して浮動小数点数に変換する単位コンバーターを使用して、datetimeオブジェクトとオブジェクトを処理できます。numpy.datetime64
Matplotlib 3.3 より前では、この変換のデフォルトは、「0000-12-31T00:00:00」からの日数である float を返します。Matplotlib 3.3 以降、デフォルトは "1970-01-01T00:00:00" からの日数です。これにより、現代の日付の解像度が向上します。古いエポックが 730120 に変換された「2020-01-01」、および 64 ビット浮動小数点数の分解能は 2^{-52}、つまり約 14 マイクロ秒であるため、マイクロ秒の精度が失われました。新しいデフォルト エポック「2020-01-01」では 10957.0 であるため、達成可能な解像度は 0.21 マイクロ秒です。
import datetime
import numpy as np

import matplotlib.pyplot as plt
import matplotlib.dates as mdates


def _reset_epoch_for_tutorial():
    """
    Users (and downstream libraries) should not use the private method of
    resetting the epoch.
    """
    mdates._reset_epoch_test_example()
日時#
Pythondatetimeオブジェクトにはマイクロ秒の解像度があるため、古いデフォルトの matplotlib 日付では、フル解像度の datetime オブジェクトを往復できませんでした。
old_epoch = '0000-12-31T00:00:00'
new_epoch = '1970-01-01T00:00:00'

_reset_epoch_for_tutorial()  # Don't do this.  Just for this tutorial.
mdates.set_epoch(old_epoch)  # old epoch (pre MPL 3.3)

date1 = datetime.datetime(2000, 1, 1, 0, 10, 0, 12,
                          tzinfo=datetime.timezone.utc)
mdate1 = mdates.date2num(date1)
print('Before Roundtrip: ', date1, 'Matplotlib date:', mdate1)
date2 = mdates.num2date(mdate1)
print('After Roundtrip:  ', date2)
Before Roundtrip:  2000-01-01 00:10:00.000012+00:00 Matplotlib date: 730120.0069444446
After Roundtrip:   2000-01-01 00:10:00.000020+00:00
これは単なる丸め誤差であり、古いエポックに近い日付には問題がないことに注意してください。
date1 = datetime.datetime(10, 1, 1, 0, 10, 0, 12,
                          tzinfo=datetime.timezone.utc)
mdate1 = mdates.date2num(date1)
print('Before Roundtrip: ', date1, 'Matplotlib date:', mdate1)
date2 = mdates.num2date(mdate1)
print('After Roundtrip:  ', date2)
Before Roundtrip:  0010-01-01 00:10:00.000012+00:00 Matplotlib date: 3288.006944444583
After Roundtrip:   0010-01-01 00:10:00.000012+00:00
ユーザーがマイクロ秒の精度で現代の日付を使用したい場合は、 を使用してエポックを変更できますset_epoch。ただし、異なるエポック間の混乱を防ぐために、日付操作の前にエポックを設定する必要があります。後でエポックを変更しようとすると、RuntimeError.
try:
    mdates.set_epoch(new_epoch)  # this is the new MPL 3.3 default.
except RuntimeError as e:
    print('RuntimeError:', str(e))
RuntimeError: set_epoch must be called before dates plotted.
このチュートリアルでは、プライベート メソッドを使用してセンチネルをリセットしますが、ユーザーはエポックを一度だけ設定する必要があります。
_reset_epoch_for_tutorial()  # Just being done for this tutorial.
mdates.set_epoch(new_epoch)

date1 = datetime.datetime(2020, 1, 1, 0, 10, 0, 12,
                          tzinfo=datetime.timezone.utc)
mdate1 = mdates.date2num(date1)
print('Before Roundtrip: ', date1, 'Matplotlib date:', mdate1)
date2 = mdates.num2date(mdate1)
print('After Roundtrip:  ', date2)
Before Roundtrip:  2020-01-01 00:10:00.000012+00:00 Matplotlib date: 18262.006944444583
After Roundtrip:   2020-01-01 00:10:00.000012+00:00
datetime64 #
numpy.datetime64オブジェクトは、オブジェクトよりもはるかに大きな時空間に対してマイクロ秒の精度を持っていdatetimeます。ただし、現在、Matplotlib の時刻は、マイクロ秒の解像度と、0000 から 9999 までしか範囲がない年を持つ datetime オブジェクトにのみ変換されます。
_reset_epoch_for_tutorial()  # Don't do this.  Just for this tutorial.
mdates.set_epoch(new_epoch)

date1 = np.datetime64('2000-01-01T00:10:00.000012')
mdate1 = mdates.date2num(date1)
print('Before Roundtrip: ', date1, 'Matplotlib date:', mdate1)
date2 = mdates.num2date(mdate1)
print('After Roundtrip:  ', date2)
Before Roundtrip:  2000-01-01T00:10:00.000012 Matplotlib date: 10957.006944444583
After Roundtrip:   2000-01-01 00:10:00.000012+00:00
プロット#
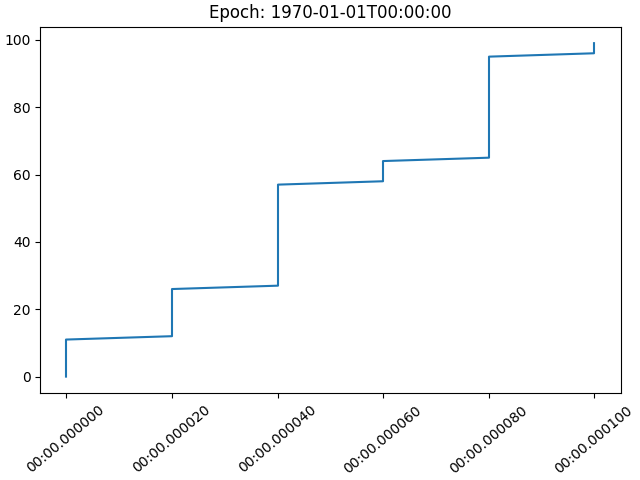
もちろん、これはすべてプロットに影響します。古いデフォルトのエポックでは、内部変換中に時間が丸められdate2num、データのジャンプにつながりました。
_reset_epoch_for_tutorial()  # Don't do this.  Just for this tutorial.
mdates.set_epoch(old_epoch)

x = np.arange('2000-01-01T00:00:00.0', '2000-01-01T00:00:00.000100',
              dtype='datetime64[us]')
# simulate the plot being made using the old epoch
xold = np.array([mdates.num2date(mdates.date2num(d)) for d in x])
y = np.arange(0, len(x))

# resetting the Epoch so plots are comparable
_reset_epoch_for_tutorial()  # Don't do this.  Just for this tutorial.
mdates.set_epoch(new_epoch)

fig, ax = plt.subplots(constrained_layout=True)
ax.plot(xold, y)
ax.set_title('Epoch: ' + mdates.get_epoch())
ax.xaxis.set_tick_params(rotation=40)
plt.show()
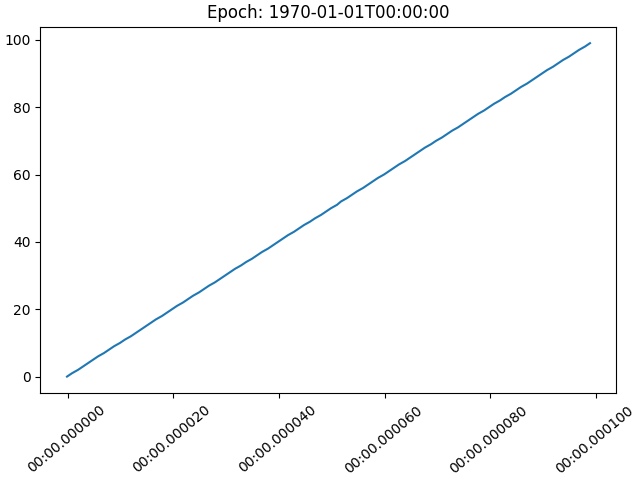
より新しいエポックを使用してプロットされた日付の場合、プロットは滑らかです。
fig, ax = plt.subplots(constrained_layout=True)
ax.plot(x, y)
ax.set_title('Epoch: ' + mdates.get_epoch())
ax.xaxis.set_tick_params(rotation=40)
plt.show()

_reset_epoch_for_tutorial()  # Don't do this.  Just for this tutorial.
参考文献
この例では、次の関数、メソッド、クラス、およびモジュールの使用が示されています。