ノート
完全なサンプルコードをダウンロードするには、ここをクリックしてください
第 2 軸#
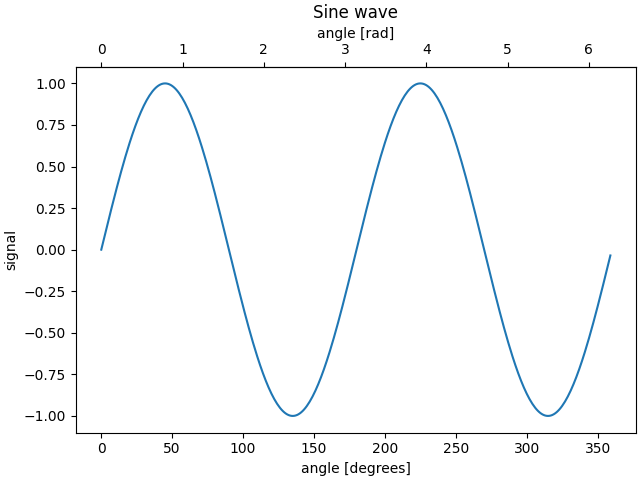
たとえば、同じプロットでラジアンを度に変換する場合など、プロットに第 2 軸が必要な場合があります。これを行うには、 と を介して 1 つの軸のみが表示される子軸を作成しaxes.Axes.secondary_xaxisます
axes.Axes.secondary_yaxis。この 2 番目の軸は、関数キーワード引数のタプルで順方向と逆方向の両方の変換関数を提供することにより、主軸とは異なるスケールを持つことができます。
import matplotlib.pyplot as plt
import numpy as np
import datetime
import matplotlib.dates as mdates
from matplotlib.ticker import AutoMinorLocator

fig, ax = plt.subplots(constrained_layout=True)
x = np.arange(0, 360, 1)
y = np.sin(2 * x * np.pi / 180)
ax.plot(x, y)
ax.set_xlabel('angle [degrees]')
ax.set_ylabel('signal')
ax.set_title('Sine wave')


def deg2rad(x):
    return x * np.pi / 180


def rad2deg(x):
    return x * 180 / np.pi


secax = ax.secondary_xaxis('top', functions=(deg2rad, rad2deg))
secax.set_xlabel('angle [rad]')
plt.show()

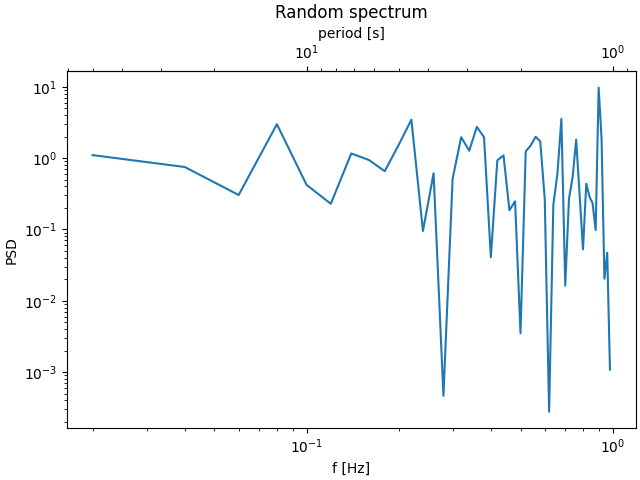
これは、対数スケールで波数から波長に変換する場合です。
ノート
この場合、親の xscale は対数であるため、子も対数になります。
fig, ax = plt.subplots(constrained_layout=True)
x = np.arange(0.02, 1, 0.02)
np.random.seed(19680801)
y = np.random.randn(len(x)) ** 2
ax.loglog(x, y)
ax.set_xlabel('f [Hz]')
ax.set_ylabel('PSD')
ax.set_title('Random spectrum')


def one_over(x):
    """Vectorized 1/x, treating x==0 manually"""
    x = np.array(x).astype(float)
    near_zero = np.isclose(x, 0)
    x[near_zero] = np.inf
    x[~near_zero] = 1 / x[~near_zero]
    return x


# the function "1/x" is its own inverse
inverse = one_over


secax = ax.secondary_xaxis('top', functions=(one_over, inverse))
secax.set_xlabel('period [s]')
plt.show()

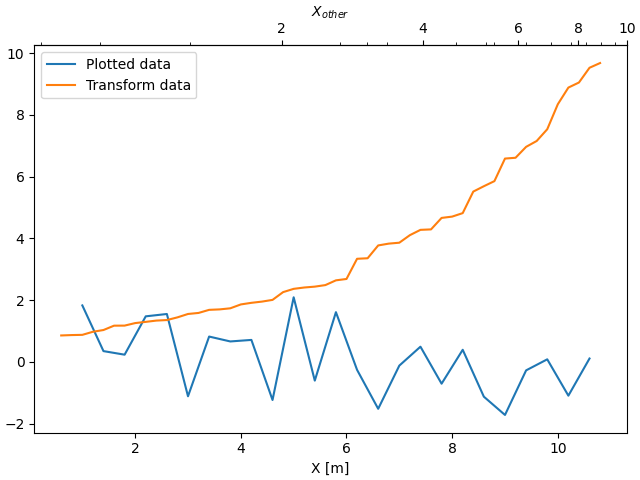
データからアドホックであり、経験的に導出される変換で軸を関連付けたい場合があります。その場合、順変換関数と逆変換関数を 1 つのデータ セットから別のデータ セットへの線形補間に設定できます。
ノート
データ マージンを適切に処理するには、マッピング関数 (この例ではforwardとinverse) を公称プロット制限を超えて定義する必要があります。
numpy 線形補間の特定のケースでは、この条件は、オプションのキーワード引数left、rightnumpy.interpを指定することで任意に適用でき、データ範囲外の値がプロットの範囲外に十分にマップされます。
fig, ax = plt.subplots(constrained_layout=True)
xdata = np.arange(1, 11, 0.4)
ydata = np.random.randn(len(xdata))
ax.plot(xdata, ydata, label='Plotted data')

xold = np.arange(0, 11, 0.2)
# fake data set relating x coordinate to another data-derived coordinate.
# xnew must be monotonic, so we sort...
xnew = np.sort(10 * np.exp(-xold / 4) + np.random.randn(len(xold)) / 3)

ax.plot(xold[3:], xnew[3:], label='Transform data')
ax.set_xlabel('X [m]')
ax.legend()


def forward(x):
    return np.interp(x, xold, xnew)


def inverse(x):
    return np.interp(x, xnew, xold)


secax = ax.secondary_xaxis('top', functions=(forward, inverse))
secax.xaxis.set_minor_locator(AutoMinorLocator())
secax.set_xlabel('$X_{other}$')

plt.show()

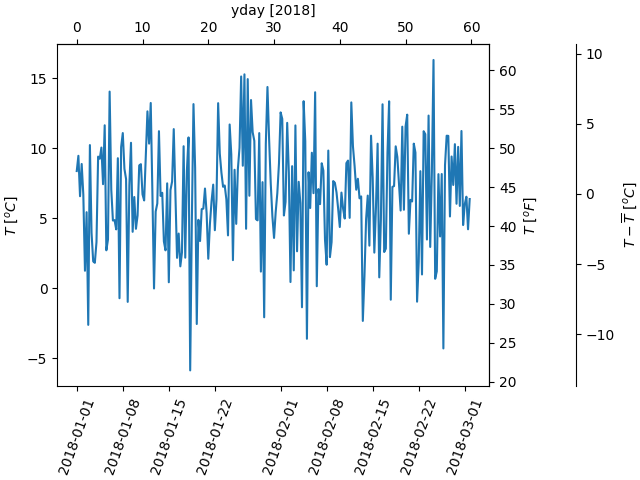
最後の例では、np.datetime64 を x 軸で yearday に変換し、y 軸で摂氏から華氏に変換します。3 番目の y 軸が追加され、位置引数に float を使用して配置できることに注意してください。
dates = [datetime.datetime(2018, 1, 1) + datetime.timedelta(hours=k * 6)
         for k in range(240)]
temperature = np.random.randn(len(dates)) * 4 + 6.7
fig, ax = plt.subplots(constrained_layout=True)

ax.plot(dates, temperature)
ax.set_ylabel(r'$T\ [^oC]$')
plt.xticks(rotation=70)


def date2yday(x):
    """Convert matplotlib datenum to days since 2018-01-01."""
    y = x - mdates.date2num(datetime.datetime(2018, 1, 1))
    return y


def yday2date(x):
    """Return a matplotlib datenum for *x* days after 2018-01-01."""
    y = x + mdates.date2num(datetime.datetime(2018, 1, 1))
    return y


secax_x = ax.secondary_xaxis('top', functions=(date2yday, yday2date))
secax_x.set_xlabel('yday [2018]')


def celsius_to_fahrenheit(x):
    return x * 1.8 + 32


def fahrenheit_to_celsius(x):
    return (x - 32) / 1.8


secax_y = ax.secondary_yaxis(
    'right', functions=(celsius_to_fahrenheit, fahrenheit_to_celsius))
secax_y.set_ylabel(r'$T\ [^oF]$')


def celsius_to_anomaly(x):
    return (x - np.mean(temperature))


def anomaly_to_celsius(x):
    return (x + np.mean(temperature))


# use of a float for the position:
secax_y2 = ax.secondary_yaxis(
    1.2, functions=(celsius_to_anomaly, anomaly_to_celsius))
secax_y2.set_ylabel(r'$T - \overline{T}\ [^oC]$')


plt.show()

参考文献
この例では、次の関数、メソッド、クラス、およびモジュールの使用が示されています。
スクリプトの合計実行時間: ( 0 分 4.894 秒)