ノート
完全なサンプルコードをダウンロードするには、ここをクリックしてください
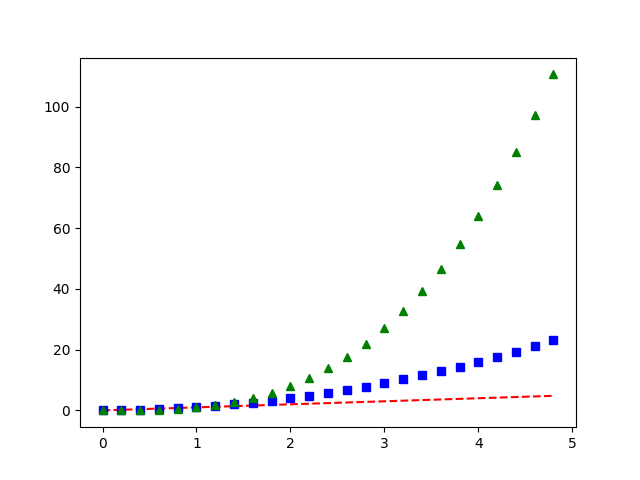
パイプロット3
への 1 回の呼び出しで 3 つのライン プロットをプロットしplotます。
import numpy as np
import matplotlib.pyplot as plt

# evenly sampled time at 200ms intervals
t = np.arange(0., 5., 0.2)

# red dashes, blue squares and green triangles
plt.plot(t, t, 'r--', t, t**2, 'bs', t, t**3, 'g^')
plt.show()
参考文献
この例では、次の関数、メソッド、クラス、およびモジュールの使用が示されています。
Sphinx-Gallery によって生成されたギャラリー