ノート
完全なサンプルコードをダウンロードするには、ここをクリックしてください
イベントデモを選択#
アーティスト (たとえば、Matplotlib Line2D、Text、Patch、Polygon、AxesImage など) の「picker」プロパティを設定することで、ピッキングを有効にすることができます。
picker プロパティにはさまざまな意味があります。
なし- このアーティストのピッキングは無効です (デフォルト)
bool - True の場合、ピッキングが有効になり、マウス イベントがアーティストの上にある場合、アーティストは pick イベントを発生させます。
設定
pickradiusによりイプシロンの許容範囲がポイント単位で追加され、データがマウス イベントのイプシロン内にある場合、アーティストはイベントを発生させます。ラインやパッチ コレクションなどの一部のアーティストの場合、アーティストは生成される pick イベントに追加データを提供する場合があります。たとえば、pick イベントのイプシロン内のデータのインデックスです。function - picker が callable の場合、アーティストがマウス イベントにヒットしたかどうかを判断するユーザー提供の関数です。
hit, props = picker(artist, mouseevent)
ヒットテストを決定します。マウス イベントがアーティストの上にある場合は、hit=True を返します。props は、PickEvent 属性に追加するプロパティの辞書です。
「ピッカー」プロパティを設定してアーティストのピッキングを有効にした後、フィギュア キャンバス pick_event に接続して、マウス プレス イベントでピッキング コールバックを取得する必要があります。例えば、
def pick_handler(event):
    mouseevent = event.mouseevent
    artist = event.artist
    # now do something with this...
コールバックに渡される pick イベント (matplotlib.backend_bases.PickEvent) は、常に次の 2 つの属性で発生します。
- マウスイベント
pick イベントを生成するマウス イベント。
マウス イベントには、x と y (左から下のピクセルなどの表示空間の座標) や xdata、ydata (データ空間の座標) などの属性があります。さらに、押されたボタン、押されたキー、マウスが置かれている軸などに関する情報を取得できます。詳細については、matplotlib.backend_bases.MouseEvent を参照してください。
- アーティスト
pick イベントを生成した matplotlib.artist。
さらに、Line2D や PatchCollection などの特定のアーティストは、ピッカー基準を満たすデータにインデックスなどの追加のメタ データを添付する場合があります (たとえば、指定されたイプシロン許容範囲内にあるライン内のすべてのポイント)。
以下の例は、これらの各方法を示しています。
ノート
これらの例は、Matplotlib のインタラクティブな機能を実行します。これは、静的ドキュメントには表示されません。このコードをマシンで実行して、対話性を確認してください。
個々の部分をコピーして貼り付けるか、ページの下部にあるリンクを使用して例全体をダウンロードできます。
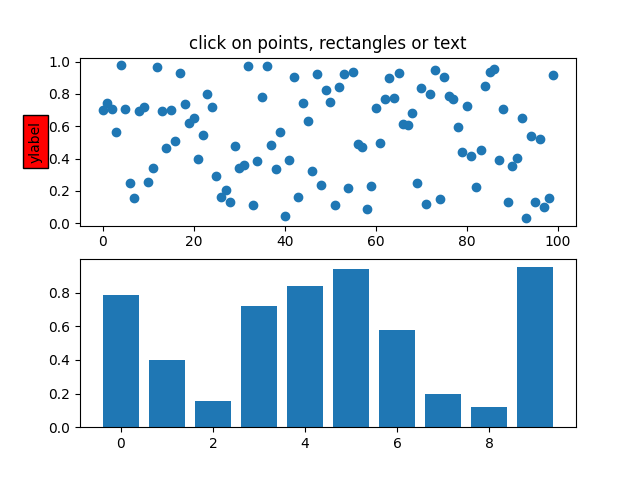
シンプルなピッキング、線、長方形、テキスト#
fig, (ax1, ax2) = plt.subplots(2, 1)
ax1.set_title('click on points, rectangles or text', picker=True)
ax1.set_ylabel('ylabel', picker=True, bbox=dict(facecolor='red'))
line, = ax1.plot(rand(100), 'o', picker=True, pickradius=5)

# Pick the rectangle.
ax2.bar(range(10), rand(10), picker=True)
for label in ax2.get_xticklabels():  # Make the xtick labels pickable.
    label.set_picker(True)


def onpick1(event):
    if isinstance(event.artist, Line2D):
        thisline = event.artist
        xdata = thisline.get_xdata()
        ydata = thisline.get_ydata()
        ind = event.ind
        print('onpick1 line:', np.column_stack([xdata[ind], ydata[ind]]))
    elif isinstance(event.artist, Rectangle):
        patch = event.artist
        print('onpick1 patch:', patch.get_path())
    elif isinstance(event.artist, Text):
        text = event.artist
        print('onpick1 text:', text.get_text())


fig.canvas.mpl_connect('pick_event', onpick1)
11
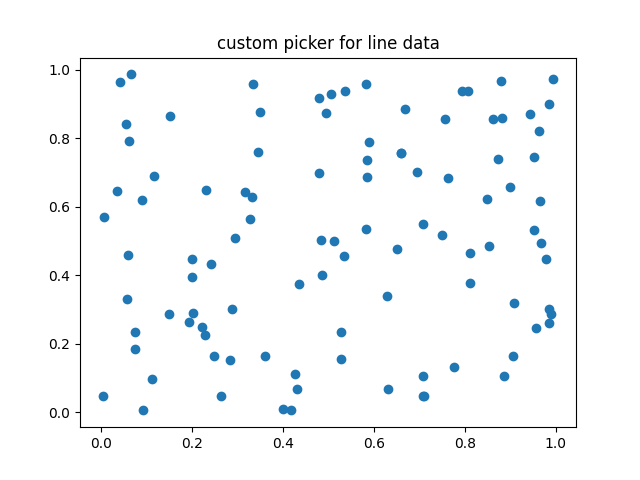
カスタムヒットテスト関数でピッキング#
picker を呼び出し可能な関数に設定することで、カスタム ピッカーを定義できます。関数には署名があります。
hit, props = func(artist, mouseevent)
ヒットテストを決定します。マウス イベントがアーティストの上にある場合は
、属性に追加するプロパティのディクショナリをhit=True返します。propsPickEvent
def line_picker(line, mouseevent):
    """
    Find the points within a certain distance from the mouseclick in
    data coords and attach some extra attributes, pickx and picky
    which are the data points that were picked.
    """
    if mouseevent.xdata is None:
        return False, dict()
    xdata = line.get_xdata()
    ydata = line.get_ydata()
    maxd = 0.05
    d = np.sqrt(
        (xdata - mouseevent.xdata)**2 + (ydata - mouseevent.ydata)**2)

    ind, = np.nonzero(d <= maxd)
    if len(ind):
        pickx = xdata[ind]
        picky = ydata[ind]
        props = dict(ind=ind, pickx=pickx, picky=picky)
        return True, props
    else:
        return False, dict()


def onpick2(event):
    print('onpick2 line:', event.pickx, event.picky)


fig, ax = plt.subplots()
ax.set_title('custom picker for line data')
line, = ax.plot(rand(100), rand(100), 'o', picker=line_picker)
fig.canvas.mpl_connect('pick_event', onpick2)
11
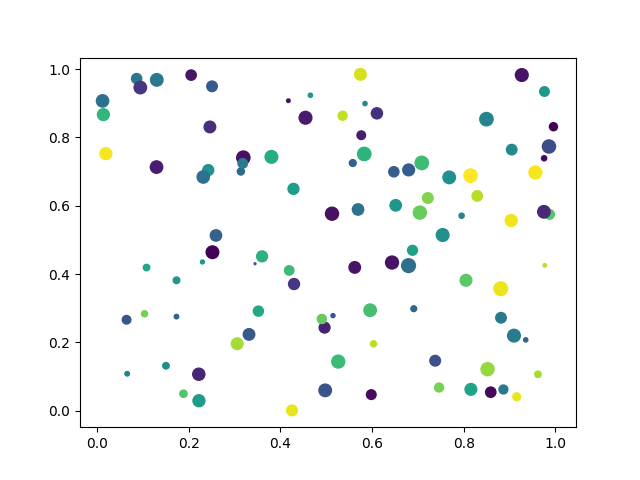
散布図の選択#
散布図はPathCollection.
x, y, c, s = rand(4, 100)


def onpick3(event):
    ind = event.ind
    print('onpick3 scatter:', ind, x[ind], y[ind])


fig, ax = plt.subplots()
ax.scatter(x, y, 100*s, c, picker=True)
fig.canvas.mpl_connect('pick_event', onpick3)
11
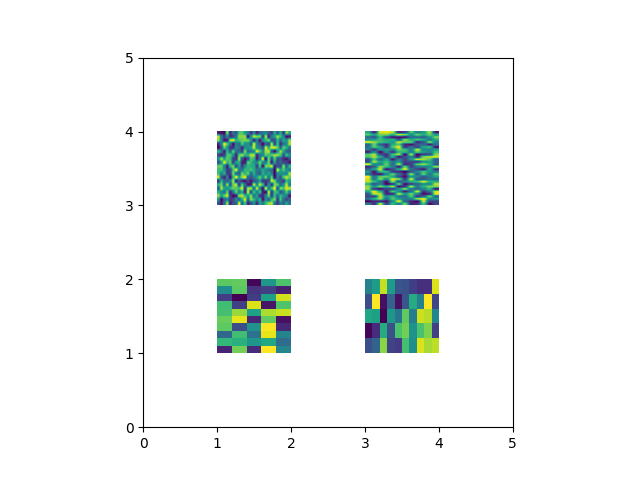
画像のピッキング#
を使用してプロットされた画像Axes.imshowはAxesImage
オブジェクトです。
fig, ax = plt.subplots()
ax.imshow(rand(10, 5), extent=(1, 2, 1, 2), picker=True)
ax.imshow(rand(5, 10), extent=(3, 4, 1, 2), picker=True)
ax.imshow(rand(20, 25), extent=(1, 2, 3, 4), picker=True)
ax.imshow(rand(30, 12), extent=(3, 4, 3, 4), picker=True)
ax.set(xlim=(0, 5), ylim=(0, 5))


def onpick4(event):
    artist = event.artist
    if isinstance(artist, AxesImage):
        im = artist
        A = im.get_array()
        print('onpick4 image', A.shape)


fig.canvas.mpl_connect('pick_event', onpick4)

plt.show()
スクリプトの合計実行時間: ( 0 分 1.456 秒)