ノート
完全なサンプルコードをダウンロードするには、ここをクリックしてください
pcolormesh グリッドとシェーディング#
axes.Axes.pcolormeshまたpcolor、グリッドのレイアウト方法とグリッド ポイント間のシェーディングに関するいくつかのオプションがあります。
一般に、Zの形状が(M, N)の場合、グリッドXおよびYは、キーワード引数の引数に応じて、形状(M+1, N+1)または(M, N)のいずれかで指定できます。以下では、ベクトルxを長さ N または N+1 として指定し、yを長さ M または M+1
として指定し、入力ベクトルからメッシュ行列XおよびYを内部的に作成するshadingことに注意してください。pcolormesh
import matplotlib.pyplot as plt
import numpy as np
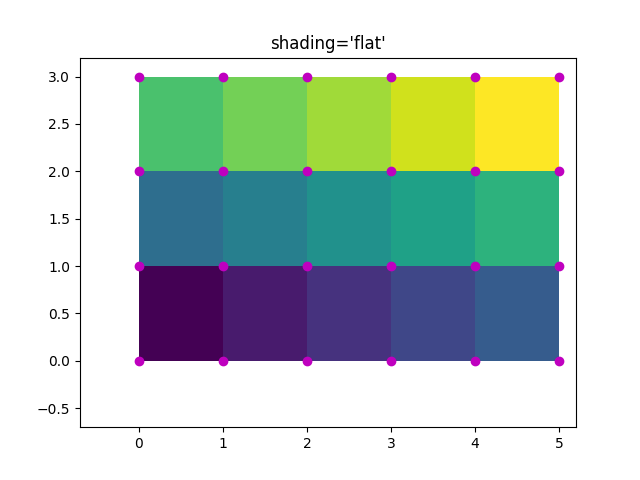
フラットシェーディング#
仮定が最小のグリッド仕様はshading='flat'
、グリッドが各次元のデータよりも 1 大きい場合、つまり
(M+1, N+1) の形状を持つ場合です。その場合、 XとYは、 Zの値で色付けされた四角形の角を指定します。ここでは、
XとYが(4, 6)である(3, 5)四辺形のエッジを指定します。
nrows = 3
ncols = 5
Z = np.arange(nrows * ncols).reshape(nrows, ncols)
x = np.arange(ncols + 1)
y = np.arange(nrows + 1)

fig, ax = plt.subplots()
ax.pcolormesh(x, y, Z, shading='flat', vmin=Z.min(), vmax=Z.max())


def _annotate(ax, x, y, title):
    # this all gets repeated below:
    X, Y = np.meshgrid(x, y)
    ax.plot(X.flat, Y.flat, 'o', color='m')
    ax.set_xlim(-0.7, 5.2)
    ax.set_ylim(-0.7, 3.2)
    ax.set_title(title)

_annotate(ax, x, y, "shading='flat'")
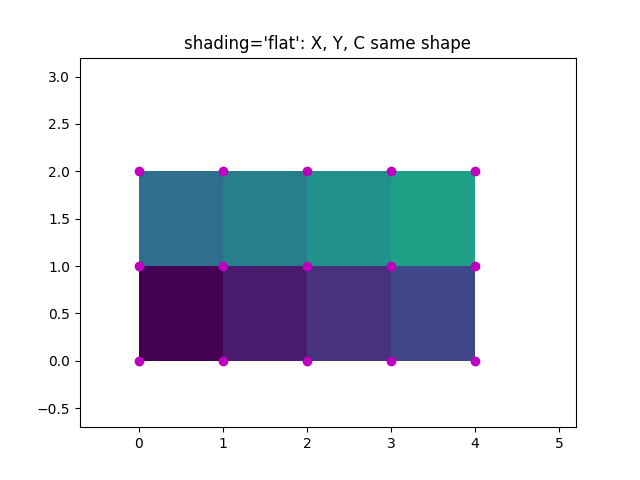
フラット シェーディング、同じ形状のグリッド#
ただし、多くの場合、 XとYがZの形状に一致するデータが提供されます。これは他のshadingタイプには意味がありますが、いつ許可されなくなりましたshading='flat'(そして、Matplotlib v3.3 の時点で MatplotlibDeprecationWarning が発生します)。歴史的に、Matplotlibは、この場合、Matlab の動作に合わせて、Zの最後の行と列をサイレントに削除しました。この動作が引き続き必要な場合は、最後の行と列を手動で削除するだけです。
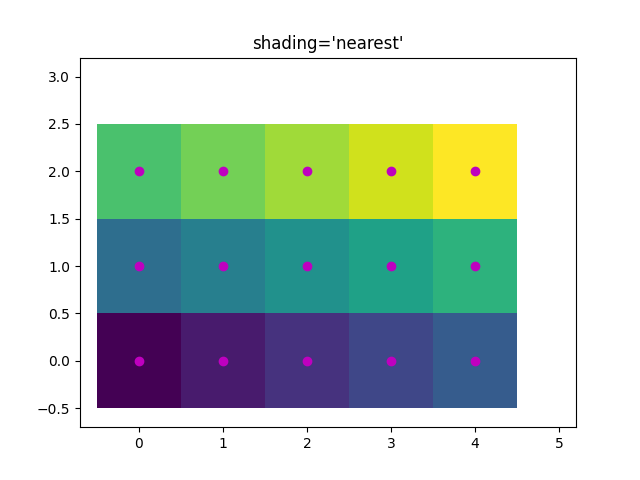
Nearest Shading、同じ形状のグリッド#
通常、データの行と列を削除することは、ユーザーがX、Y、およびZをすべて同じ形状にするときに意味することではありません。この場合、Matplotlibshading='nearest'は色付きの四角形をグリッド ポイント上で許可し、中央に配置します。
正しい形状ではないグリッドが渡されshading='nearest'
た場合、エラーが発生します。
fig, ax = plt.subplots()
ax.pcolormesh(x, y, Z, shading='nearest', vmin=Z.min(), vmax=Z.max())
_annotate(ax, x, y, "shading='nearest'")
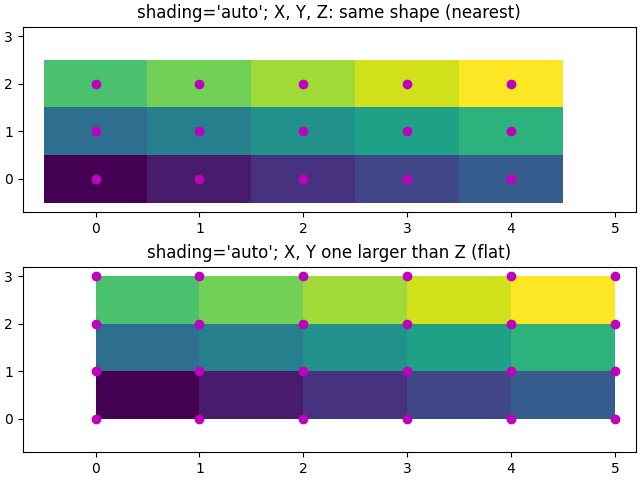
オートシェーディング#
ユーザーは、どちらを使用するかをコードで自動的に選択することを希望する可能性があります。この場合、 X、Y、およびZshading='auto'の形状に基づいて、「フラット」シェーディングまたは「最近接」シェーディングのどちらを使用するかを決定します。
fig, axs = plt.subplots(2, 1, constrained_layout=True)
ax = axs[0]
x = np.arange(ncols)
y = np.arange(nrows)
ax.pcolormesh(x, y, Z, shading='auto', vmin=Z.min(), vmax=Z.max())
_annotate(ax, x, y, "shading='auto'; X, Y, Z: same shape (nearest)")

ax = axs[1]
x = np.arange(ncols + 1)
y = np.arange(nrows + 1)
ax.pcolormesh(x, y, Z, shading='auto', vmin=Z.min(), vmax=Z.max())
_annotate(ax, x, y, "shading='auto'; X, Y one larger than Z (flat)")
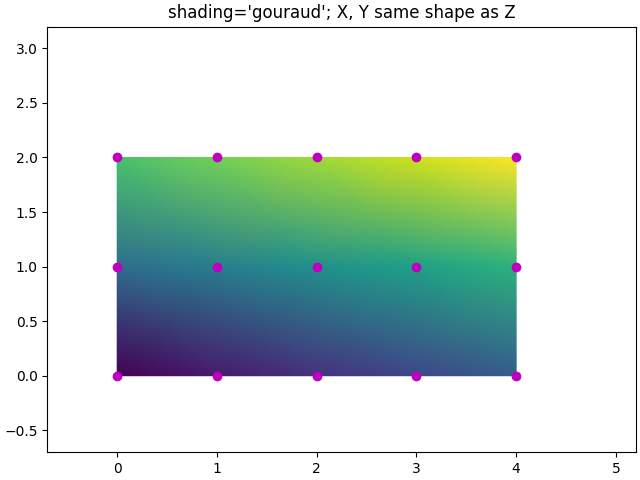
グーロー シェーディング#
グーロー シェーディングも指定できます。この場合、四角形の色がグリッド ポイント間で線形補間されます。X、Y、Zの形状は同じでなければなりません。
参考文献
この例では、次の関数、メソッド、クラス、およびモジュールの使用が示されています。
スクリプトの合計実行時間: ( 0 分 2.324 秒)